South African vs Immigrants from Barbados In Labor Force | Age 45-54
COMPARE
South African
Immigrants from Barbados
In Labor Force | Age 45-54
In Labor Force | Age 45-54 Comparison
South Africans
Immigrants from Barbados
82.6%
IN LABOR FORCE | AGE 45-54
28.0/ 100
METRIC RATING
188th/ 347
METRIC RANK
81.3%
IN LABOR FORCE | AGE 45-54
0.0/ 100
METRIC RATING
271st/ 347
METRIC RANK
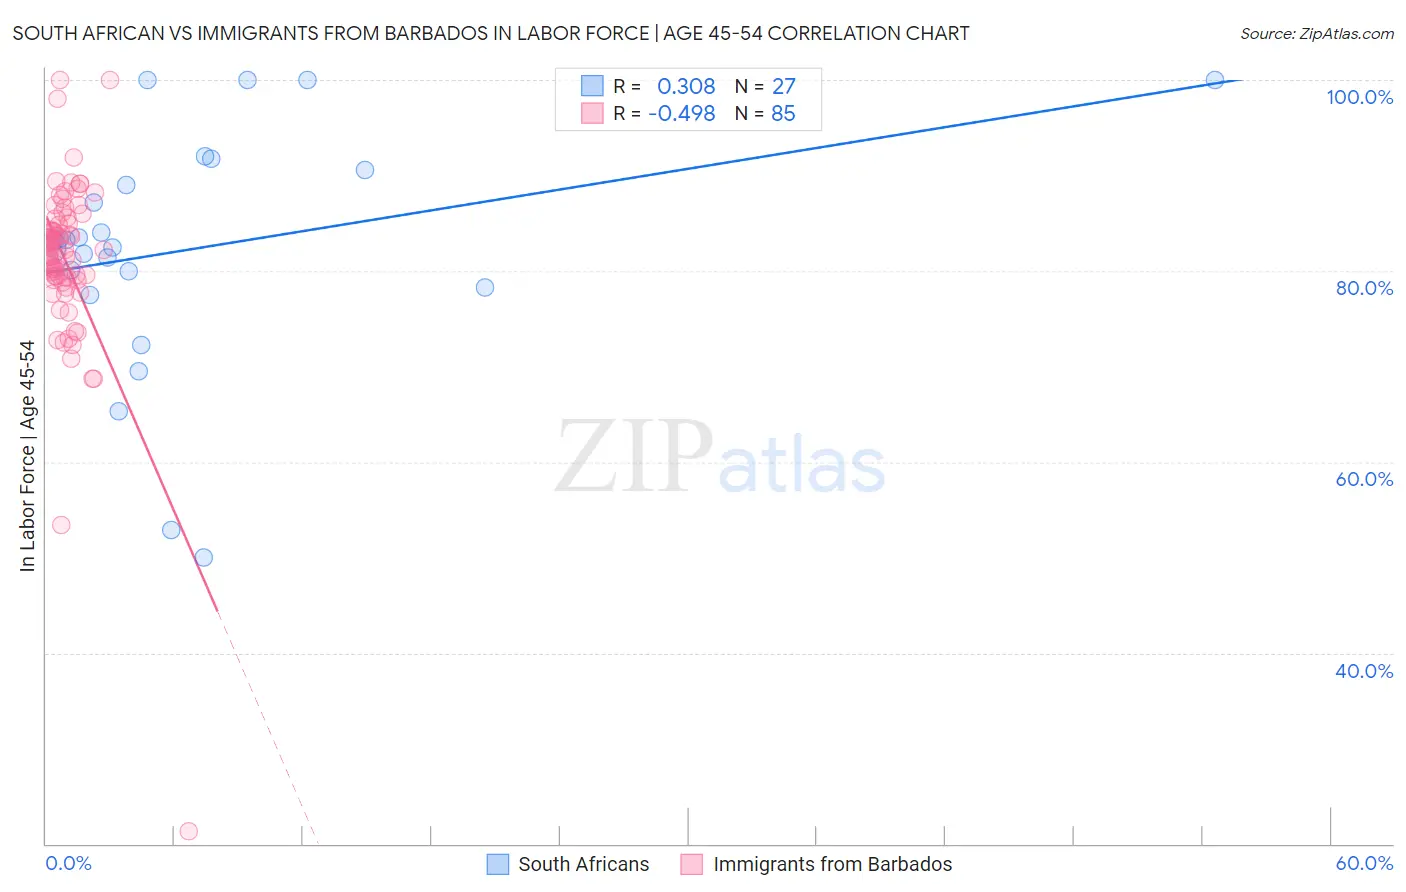
South African vs Immigrants from Barbados In Labor Force | Age 45-54 Correlation Chart
The statistical analysis conducted on geographies consisting of 182,539,352 people shows a mild positive correlation between the proportion of South Africans and labor force participation rate among population between the ages 45 and 54 in the United States with a correlation coefficient (R) of 0.308 and weighted average of 82.6%. Similarly, the statistical analysis conducted on geographies consisting of 112,763,171 people shows a moderate negative correlation between the proportion of Immigrants from Barbados and labor force participation rate among population between the ages 45 and 54 in the United States with a correlation coefficient (R) of -0.498 and weighted average of 81.3%, a difference of 1.6%.
In Labor Force | Age 45-54 Correlation Summary
| Measurement | South African | Immigrants from Barbados |
| Minimum | 50.0% | 21.3% |
| Maximum | 100.0% | 100.0% |
| Range | 50.0% | 78.7% |
| Mean | 82.3% | 81.2% |
| Median | 83.2% | 82.2% |
| Interquartile 25% (IQ1) | 78.2% | 79.3% |
| Interquartile 75% (IQ3) | 90.6% | 84.9% |
| Interquartile Range (IQR) | 12.4% | 5.6% |
| Standard Deviation (Sample) | 12.5% | 9.3% |
| Standard Deviation (Population) | 12.3% | 9.2% |
Similar Demographics by In Labor Force | Age 45-54
Demographics Similar to South Africans by In Labor Force | Age 45-54
In terms of in labor force | age 45-54, the demographic groups most similar to South Africans are Immigrants from Costa Rica (82.6%, a difference of 0.0%), Irish (82.6%, a difference of 0.010%), Syrian (82.6%, a difference of 0.020%), British (82.6%, a difference of 0.030%), and Immigrants from England (82.6%, a difference of 0.040%).
| Demographics | Rating | Rank | In Labor Force | Age 45-54 |
| Israelis | 37.7 /100 | #181 | Fair 82.7% |
| Immigrants | Hungary | 37.1 /100 | #182 | Fair 82.7% |
| New Zealanders | 32.7 /100 | #183 | Fair 82.6% |
| Europeans | 32.6 /100 | #184 | Fair 82.6% |
| Immigrants | England | 32.2 /100 | #185 | Fair 82.6% |
| Irish | 29.2 /100 | #186 | Fair 82.6% |
| Immigrants | Costa Rica | 28.3 /100 | #187 | Fair 82.6% |
| South Africans | 28.0 /100 | #188 | Fair 82.6% |
| Syrians | 26.0 /100 | #189 | Fair 82.6% |
| British | 25.7 /100 | #190 | Fair 82.6% |
| Armenians | 23.2 /100 | #191 | Fair 82.5% |
| Immigrants | Iraq | 20.9 /100 | #192 | Fair 82.5% |
| Australians | 20.8 /100 | #193 | Fair 82.5% |
| Immigrants | Norway | 20.7 /100 | #194 | Fair 82.5% |
| Immigrants | Canada | 20.0 /100 | #195 | Fair 82.5% |
Demographics Similar to Immigrants from Barbados by In Labor Force | Age 45-54
In terms of in labor force | age 45-54, the demographic groups most similar to Immigrants from Barbados are Bangladeshi (81.3%, a difference of 0.010%), Spanish (81.3%, a difference of 0.010%), Alsatian (81.3%, a difference of 0.040%), Immigrants from Honduras (81.4%, a difference of 0.060%), and Chippewa (81.3%, a difference of 0.070%).
| Demographics | Rating | Rank | In Labor Force | Age 45-54 |
| Immigrants | West Indies | 0.1 /100 | #264 | Tragic 81.5% |
| Hondurans | 0.1 /100 | #265 | Tragic 81.4% |
| Immigrants | St. Vincent and the Grenadines | 0.1 /100 | #266 | Tragic 81.4% |
| West Indians | 0.1 /100 | #267 | Tragic 81.4% |
| Immigrants | Honduras | 0.0 /100 | #268 | Tragic 81.4% |
| Alsatians | 0.0 /100 | #269 | Tragic 81.3% |
| Bangladeshis | 0.0 /100 | #270 | Tragic 81.3% |
| Immigrants | Barbados | 0.0 /100 | #271 | Tragic 81.3% |
| Spanish | 0.0 /100 | #272 | Tragic 81.3% |
| Chippewa | 0.0 /100 | #273 | Tragic 81.3% |
| British West Indians | 0.0 /100 | #274 | Tragic 81.2% |
| Immigrants | Nonimmigrants | 0.0 /100 | #275 | Tragic 81.2% |
| U.S. Virgin Islanders | 0.0 /100 | #276 | Tragic 81.2% |
| Guatemalans | 0.0 /100 | #277 | Tragic 81.2% |
| Immigrants | Guatemala | 0.0 /100 | #278 | Tragic 81.1% |