Welsh vs Immigrants from Barbados In Labor Force | Age 45-54
COMPARE
Welsh
Immigrants from Barbados
In Labor Force | Age 45-54
In Labor Force | Age 45-54 Comparison
Welsh
Immigrants from Barbados
82.3%
IN LABOR FORCE | AGE 45-54
9.2/ 100
METRIC RATING
206th/ 347
METRIC RANK
81.3%
IN LABOR FORCE | AGE 45-54
0.0/ 100
METRIC RATING
271st/ 347
METRIC RANK
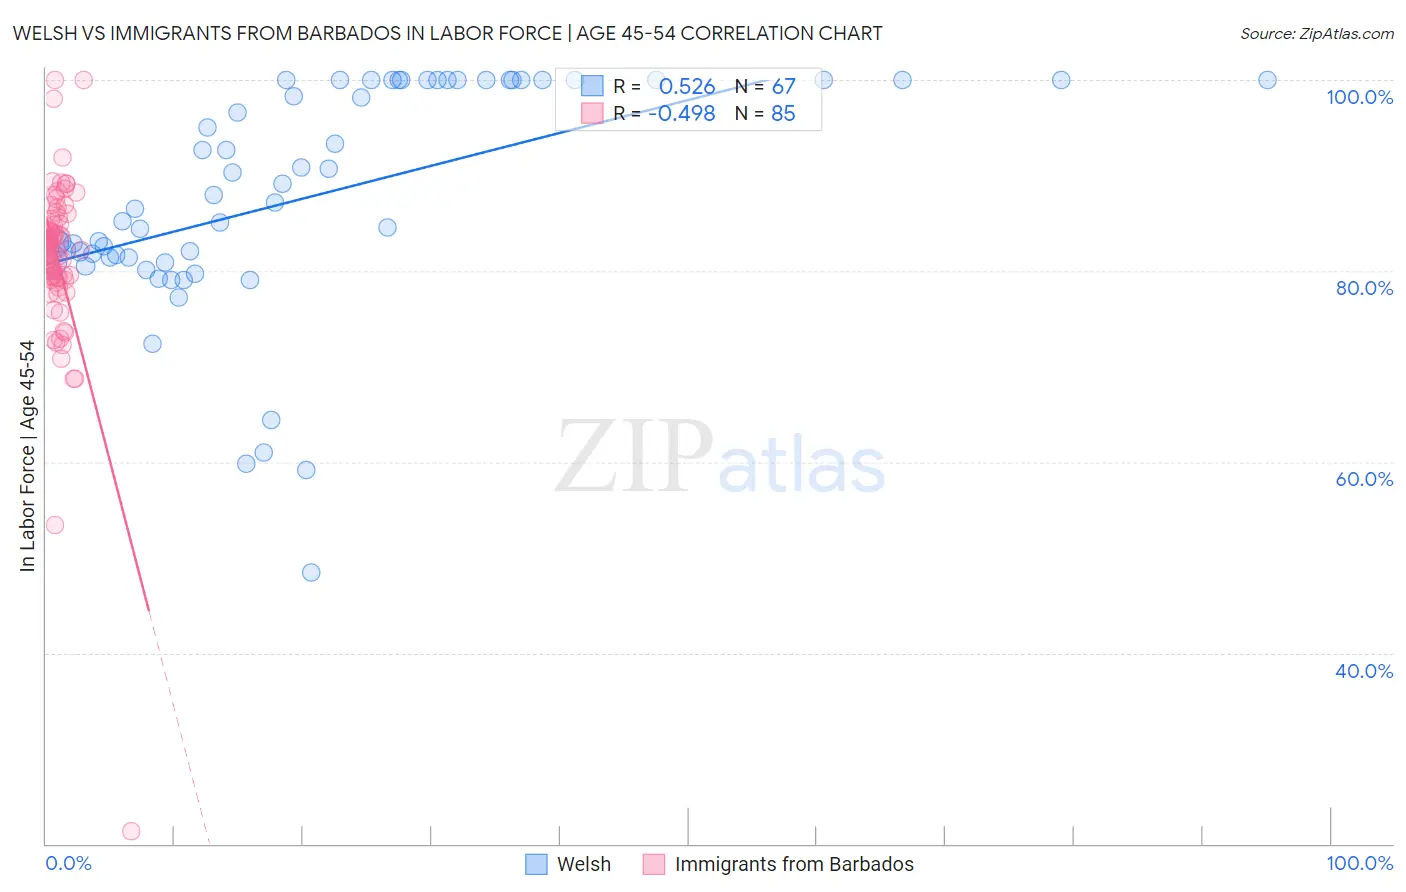
Welsh vs Immigrants from Barbados In Labor Force | Age 45-54 Correlation Chart
The statistical analysis conducted on geographies consisting of 528,109,261 people shows a substantial positive correlation between the proportion of Welsh and labor force participation rate among population between the ages 45 and 54 in the United States with a correlation coefficient (R) of 0.526 and weighted average of 82.3%. Similarly, the statistical analysis conducted on geographies consisting of 112,763,171 people shows a moderate negative correlation between the proportion of Immigrants from Barbados and labor force participation rate among population between the ages 45 and 54 in the United States with a correlation coefficient (R) of -0.498 and weighted average of 81.3%, a difference of 1.3%.
In Labor Force | Age 45-54 Correlation Summary
| Measurement | Welsh | Immigrants from Barbados |
| Minimum | 48.4% | 21.3% |
| Maximum | 100.0% | 100.0% |
| Range | 51.6% | 78.7% |
| Mean | 87.7% | 81.2% |
| Median | 87.2% | 82.2% |
| Interquartile 25% (IQ1) | 81.4% | 79.3% |
| Interquartile 75% (IQ3) | 100.0% | 84.9% |
| Interquartile Range (IQR) | 18.6% | 5.6% |
| Standard Deviation (Sample) | 11.9% | 9.3% |
| Standard Deviation (Population) | 11.8% | 9.2% |
Similar Demographics by In Labor Force | Age 45-54
Demographics Similar to Welsh by In Labor Force | Age 45-54
In terms of in labor force | age 45-54, the demographic groups most similar to Welsh are Senegalese (82.4%, a difference of 0.010%), Immigrants from Cabo Verde (82.3%, a difference of 0.020%), Native Hawaiian (82.3%, a difference of 0.020%), Immigrants from Western Europe (82.4%, a difference of 0.040%), and Immigrants from Lebanon (82.3%, a difference of 0.050%).
| Demographics | Rating | Rank | In Labor Force | Age 45-54 |
| Moroccans | 15.7 /100 | #199 | Poor 82.5% |
| French Canadians | 15.4 /100 | #200 | Poor 82.5% |
| Canadians | 15.1 /100 | #201 | Poor 82.4% |
| Immigrants | Western Asia | 14.9 /100 | #202 | Poor 82.4% |
| Arabs | 11.6 /100 | #203 | Poor 82.4% |
| Immigrants | Western Europe | 10.9 /100 | #204 | Poor 82.4% |
| Senegalese | 9.5 /100 | #205 | Tragic 82.4% |
| Welsh | 9.2 /100 | #206 | Tragic 82.3% |
| Immigrants | Cabo Verde | 8.6 /100 | #207 | Tragic 82.3% |
| Native Hawaiians | 8.5 /100 | #208 | Tragic 82.3% |
| Immigrants | Lebanon | 7.4 /100 | #209 | Tragic 82.3% |
| Immigrants | Bahamas | 7.1 /100 | #210 | Tragic 82.3% |
| Immigrants | Syria | 6.6 /100 | #211 | Tragic 82.3% |
| Ecuadorians | 6.3 /100 | #212 | Tragic 82.3% |
| Immigrants | Uzbekistan | 5.8 /100 | #213 | Tragic 82.3% |
Demographics Similar to Immigrants from Barbados by In Labor Force | Age 45-54
In terms of in labor force | age 45-54, the demographic groups most similar to Immigrants from Barbados are Bangladeshi (81.3%, a difference of 0.010%), Spanish (81.3%, a difference of 0.010%), Alsatian (81.3%, a difference of 0.040%), Immigrants from Honduras (81.4%, a difference of 0.060%), and Chippewa (81.3%, a difference of 0.070%).
| Demographics | Rating | Rank | In Labor Force | Age 45-54 |
| Immigrants | West Indies | 0.1 /100 | #264 | Tragic 81.5% |
| Hondurans | 0.1 /100 | #265 | Tragic 81.4% |
| Immigrants | St. Vincent and the Grenadines | 0.1 /100 | #266 | Tragic 81.4% |
| West Indians | 0.1 /100 | #267 | Tragic 81.4% |
| Immigrants | Honduras | 0.0 /100 | #268 | Tragic 81.4% |
| Alsatians | 0.0 /100 | #269 | Tragic 81.3% |
| Bangladeshis | 0.0 /100 | #270 | Tragic 81.3% |
| Immigrants | Barbados | 0.0 /100 | #271 | Tragic 81.3% |
| Spanish | 0.0 /100 | #272 | Tragic 81.3% |
| Chippewa | 0.0 /100 | #273 | Tragic 81.3% |
| British West Indians | 0.0 /100 | #274 | Tragic 81.2% |
| Immigrants | Nonimmigrants | 0.0 /100 | #275 | Tragic 81.2% |
| U.S. Virgin Islanders | 0.0 /100 | #276 | Tragic 81.2% |
| Guatemalans | 0.0 /100 | #277 | Tragic 81.2% |
| Immigrants | Guatemala | 0.0 /100 | #278 | Tragic 81.1% |