Carpatho Rusyn vs Irish High School Diploma
COMPARE
Carpatho Rusyn
Irish
High School Diploma
High School Diploma Comparison
Carpatho Rusyns
Irish
92.1%
HIGH SCHOOL DIPLOMA
100.0/ 100
METRIC RATING
3rd/ 347
METRIC RANK
91.4%
HIGH SCHOOL DIPLOMA
99.9/ 100
METRIC RATING
35th/ 347
METRIC RANK
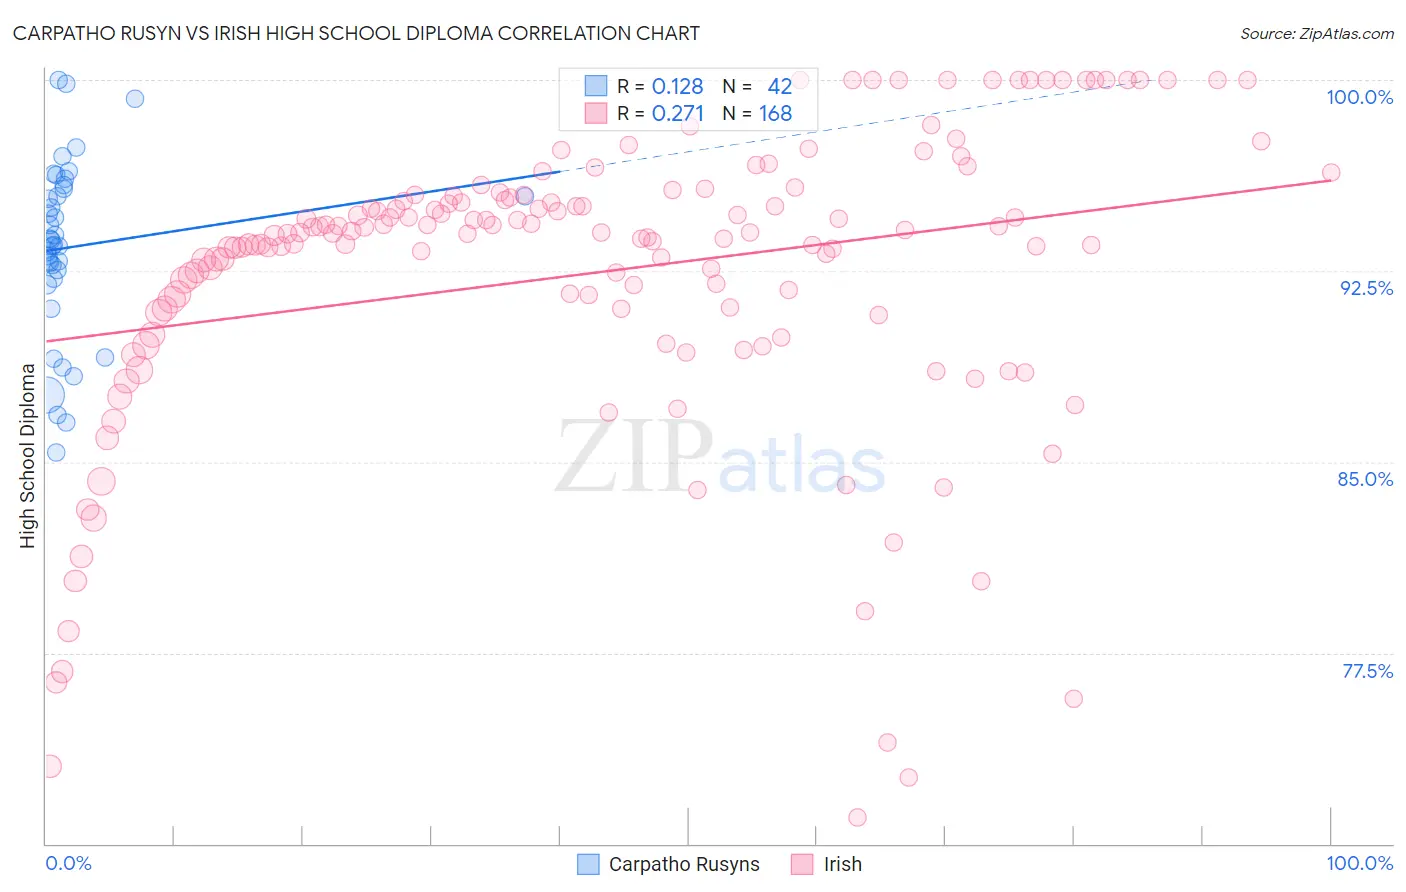
Carpatho Rusyn vs Irish High School Diploma Correlation Chart
The statistical analysis conducted on geographies consisting of 58,871,690 people shows a poor positive correlation between the proportion of Carpatho Rusyns and percentage of population with at least high school diploma education in the United States with a correlation coefficient (R) of 0.128 and weighted average of 92.1%. Similarly, the statistical analysis conducted on geographies consisting of 580,709,825 people shows a weak positive correlation between the proportion of Irish and percentage of population with at least high school diploma education in the United States with a correlation coefficient (R) of 0.271 and weighted average of 91.4%, a difference of 0.79%.
High School Diploma Correlation Summary
| Measurement | Carpatho Rusyn | Irish |
| Minimum | 85.4% | 71.0% |
| Maximum | 100.0% | 100.0% |
| Range | 14.6% | 29.0% |
| Mean | 93.4% | 92.4% |
| Median | 93.6% | 94.0% |
| Interquartile 25% (IQ1) | 92.2% | 90.9% |
| Interquartile 75% (IQ3) | 95.7% | 95.3% |
| Interquartile Range (IQR) | 3.5% | 4.4% |
| Standard Deviation (Sample) | 3.5% | 5.9% |
| Standard Deviation (Population) | 3.4% | 5.9% |
Similar Demographics by High School Diploma
Demographics Similar to Carpatho Rusyns by High School Diploma
In terms of high school diploma, the demographic groups most similar to Carpatho Rusyns are Lithuanian (92.0%, a difference of 0.060%), Slovene (92.0%, a difference of 0.060%), Slovak (92.0%, a difference of 0.080%), Immigrants from India (92.0%, a difference of 0.090%), and Swedish (92.2%, a difference of 0.10%).
| Demographics | Rating | Rank | High School Diploma |
| Norwegians | 100.0 /100 | #1 | Exceptional 92.5% |
| Swedes | 100.0 /100 | #2 | Exceptional 92.2% |
| Carpatho Rusyns | 100.0 /100 | #3 | Exceptional 92.1% |
| Lithuanians | 100.0 /100 | #4 | Exceptional 92.0% |
| Slovenes | 100.0 /100 | #5 | Exceptional 92.0% |
| Slovaks | 100.0 /100 | #6 | Exceptional 92.0% |
| Immigrants | India | 100.0 /100 | #7 | Exceptional 92.0% |
| Chinese | 100.0 /100 | #8 | Exceptional 92.0% |
| Latvians | 100.0 /100 | #9 | Exceptional 92.0% |
| Croatians | 100.0 /100 | #10 | Exceptional 92.0% |
| Eastern Europeans | 100.0 /100 | #11 | Exceptional 91.9% |
| Poles | 100.0 /100 | #12 | Exceptional 91.9% |
| Danes | 100.0 /100 | #13 | Exceptional 91.8% |
| Bulgarians | 100.0 /100 | #14 | Exceptional 91.8% |
| Luxembourgers | 100.0 /100 | #15 | Exceptional 91.7% |
Demographics Similar to Irish by High School Diploma
In terms of high school diploma, the demographic groups most similar to Irish are Okinawan (91.4%, a difference of 0.030%), Scottish (91.4%, a difference of 0.030%), Tsimshian (91.3%, a difference of 0.030%), Immigrants from Northern Europe (91.4%, a difference of 0.040%), and English (91.4%, a difference of 0.040%).
| Demographics | Rating | Rank | High School Diploma |
| Tlingit-Haida | 99.9 /100 | #28 | Exceptional 91.4% |
| Europeans | 99.9 /100 | #29 | Exceptional 91.4% |
| Iranians | 99.9 /100 | #30 | Exceptional 91.4% |
| Immigrants | Northern Europe | 99.9 /100 | #31 | Exceptional 91.4% |
| English | 99.9 /100 | #32 | Exceptional 91.4% |
| Okinawans | 99.9 /100 | #33 | Exceptional 91.4% |
| Scottish | 99.9 /100 | #34 | Exceptional 91.4% |
| Irish | 99.9 /100 | #35 | Exceptional 91.4% |
| Tsimshian | 99.9 /100 | #36 | Exceptional 91.3% |
| Immigrants | Ireland | 99.9 /100 | #37 | Exceptional 91.3% |
| Immigrants | Scotland | 99.8 /100 | #38 | Exceptional 91.3% |
| Dutch | 99.8 /100 | #39 | Exceptional 91.3% |
| Immigrants | Lithuania | 99.8 /100 | #40 | Exceptional 91.3% |
| Immigrants | Australia | 99.8 /100 | #41 | Exceptional 91.3% |
| Northern Europeans | 99.8 /100 | #42 | Exceptional 91.3% |