Carpatho Rusyn vs Pennsylvania German In Labor Force | Age 16-19
COMPARE
Carpatho Rusyn
Pennsylvania German
In Labor Force | Age 16-19
In Labor Force | Age 16-19 Comparison
Carpatho Rusyns
Pennsylvania Germans
40.8%
IN LABOR FORCE | AGE 16-19
100.0/ 100
METRIC RATING
47th/ 347
METRIC RANK
46.4%
IN LABOR FORCE | AGE 16-19
100.0/ 100
METRIC RATING
1st/ 347
METRIC RANK
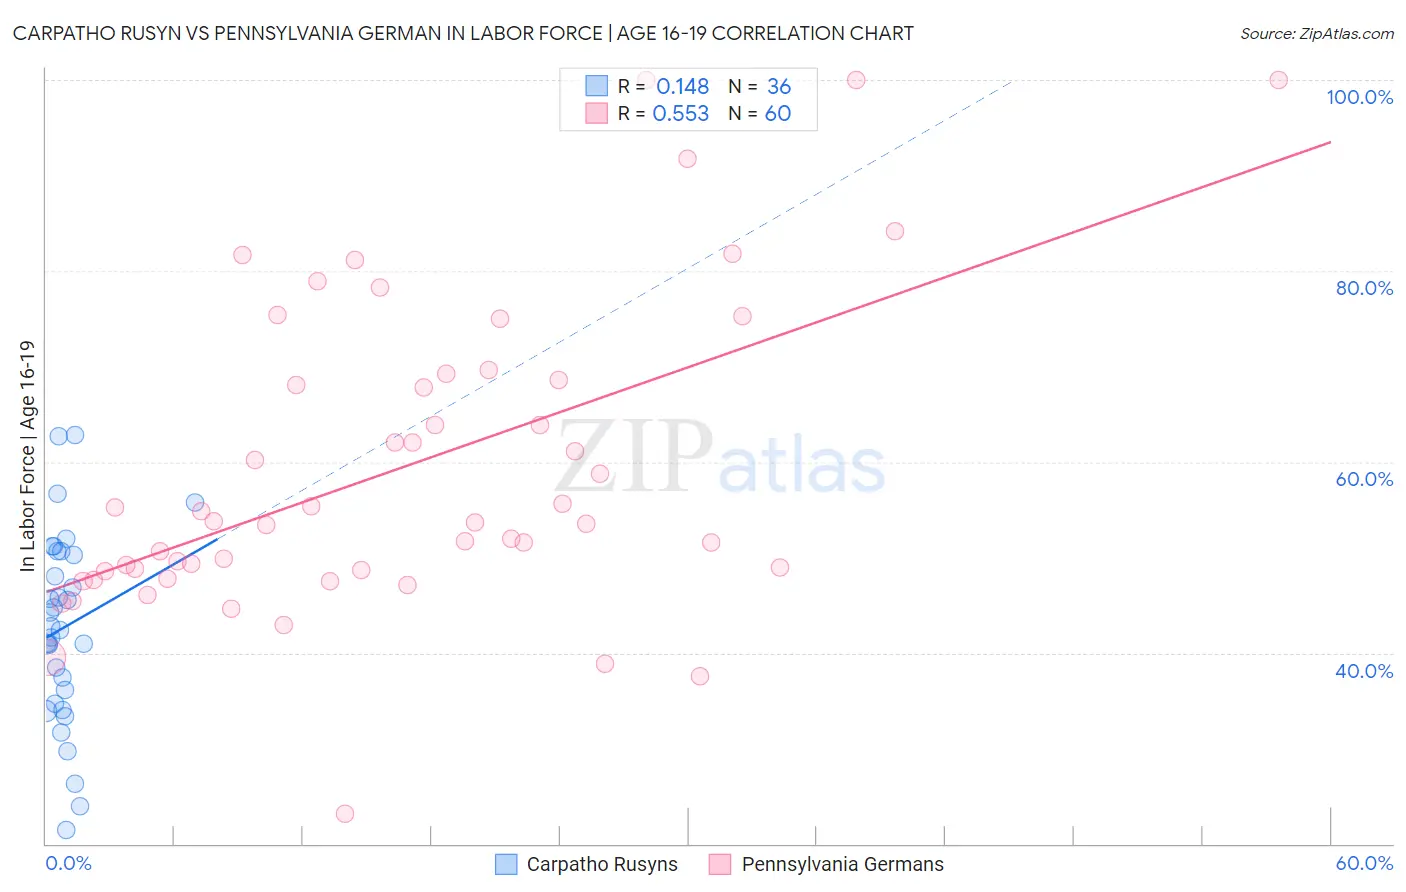
Carpatho Rusyn vs Pennsylvania German In Labor Force | Age 16-19 Correlation Chart
The statistical analysis conducted on geographies consisting of 58,860,785 people shows a poor positive correlation between the proportion of Carpatho Rusyns and labor force participation rate among population between the ages 16 and 19 in the United States with a correlation coefficient (R) of 0.148 and weighted average of 40.8%. Similarly, the statistical analysis conducted on geographies consisting of 233,701,573 people shows a substantial positive correlation between the proportion of Pennsylvania Germans and labor force participation rate among population between the ages 16 and 19 in the United States with a correlation coefficient (R) of 0.553 and weighted average of 46.4%, a difference of 13.8%.
In Labor Force | Age 16-19 Correlation Summary
| Measurement | Carpatho Rusyn | Pennsylvania German |
| Minimum | 21.5% | 23.1% |
| Maximum | 62.8% | 100.0% |
| Range | 41.3% | 76.9% |
| Mean | 42.7% | 59.4% |
| Median | 42.6% | 53.7% |
| Interquartile 25% (IQ1) | 35.4% | 48.6% |
| Interquartile 75% (IQ3) | 50.5% | 68.9% |
| Interquartile Range (IQR) | 15.1% | 20.3% |
| Standard Deviation (Sample) | 9.9% | 16.4% |
| Standard Deviation (Population) | 9.8% | 16.2% |
Similar Demographics by In Labor Force | Age 16-19
Demographics Similar to Carpatho Rusyns by In Labor Force | Age 16-19
In terms of in labor force | age 16-19, the demographic groups most similar to Carpatho Rusyns are Icelander (40.8%, a difference of 0.050%), Cree (40.8%, a difference of 0.070%), Indonesian (40.7%, a difference of 0.23%), Immigrants from Zaire (40.7%, a difference of 0.33%), and Immigrants from Laos (40.6%, a difference of 0.42%).
| Demographics | Rating | Rank | In Labor Force | Age 16-19 |
| Immigrants | Liberia | 100.0 /100 | #40 | Exceptional 41.5% |
| Celtics | 100.0 /100 | #41 | Exceptional 41.3% |
| Whites/Caucasians | 100.0 /100 | #42 | Exceptional 41.3% |
| Tongans | 100.0 /100 | #43 | Exceptional 41.2% |
| Europeans | 100.0 /100 | #44 | Exceptional 41.1% |
| Croatians | 100.0 /100 | #45 | Exceptional 41.1% |
| Immigrants | Sudan | 100.0 /100 | #46 | Exceptional 41.0% |
| Carpatho Rusyns | 100.0 /100 | #47 | Exceptional 40.8% |
| Icelanders | 100.0 /100 | #48 | Exceptional 40.8% |
| Cree | 100.0 /100 | #49 | Exceptional 40.8% |
| Indonesians | 100.0 /100 | #50 | Exceptional 40.7% |
| Immigrants | Zaire | 100.0 /100 | #51 | Exceptional 40.7% |
| Immigrants | Laos | 100.0 /100 | #52 | Exceptional 40.6% |
| Immigrants | Kenya | 100.0 /100 | #53 | Exceptional 40.5% |
| Tlingit-Haida | 100.0 /100 | #54 | Exceptional 40.5% |
Demographics Similar to Pennsylvania Germans by In Labor Force | Age 16-19
In terms of in labor force | age 16-19, the demographic groups most similar to Pennsylvania Germans are Norwegian (46.2%, a difference of 0.56%), Immigrants from Somalia (45.6%, a difference of 1.9%), Luxembourger (45.3%, a difference of 2.5%), Alaskan Athabascan (45.2%, a difference of 2.7%), and Somali (45.1%, a difference of 2.9%).
| Demographics | Rating | Rank | In Labor Force | Age 16-19 |
| Pennsylvania Germans | 100.0 /100 | #1 | Exceptional 46.4% |
| Norwegians | 100.0 /100 | #2 | Exceptional 46.2% |
| Immigrants | Somalia | 100.0 /100 | #3 | Exceptional 45.6% |
| Luxembourgers | 100.0 /100 | #4 | Exceptional 45.3% |
| Alaskan Athabascans | 100.0 /100 | #5 | Exceptional 45.2% |
| Somalis | 100.0 /100 | #6 | Exceptional 45.1% |
| Danes | 100.0 /100 | #7 | Exceptional 44.7% |
| Immigrants | Cabo Verde | 100.0 /100 | #8 | Exceptional 44.7% |
| Cape Verdeans | 100.0 /100 | #9 | Exceptional 44.5% |
| Germans | 100.0 /100 | #10 | Exceptional 44.2% |
| Swedes | 100.0 /100 | #11 | Exceptional 44.1% |
| Finns | 100.0 /100 | #12 | Exceptional 43.9% |
| Dutch | 100.0 /100 | #13 | Exceptional 43.8% |
| Chippewa | 100.0 /100 | #14 | Exceptional 43.8% |
| Slovenes | 100.0 /100 | #15 | Exceptional 43.7% |