Canadian vs Houma Doctorate Degree
COMPARE
Canadian
Houma
Doctorate Degree
Doctorate Degree Comparison
Canadians
Houma
2.0%
DOCTORATE DEGREE
90.6/ 100
METRIC RATING
129th/ 347
METRIC RANK
0.96%
DOCTORATE DEGREE
0.0/ 100
METRIC RATING
347th/ 347
METRIC RANK
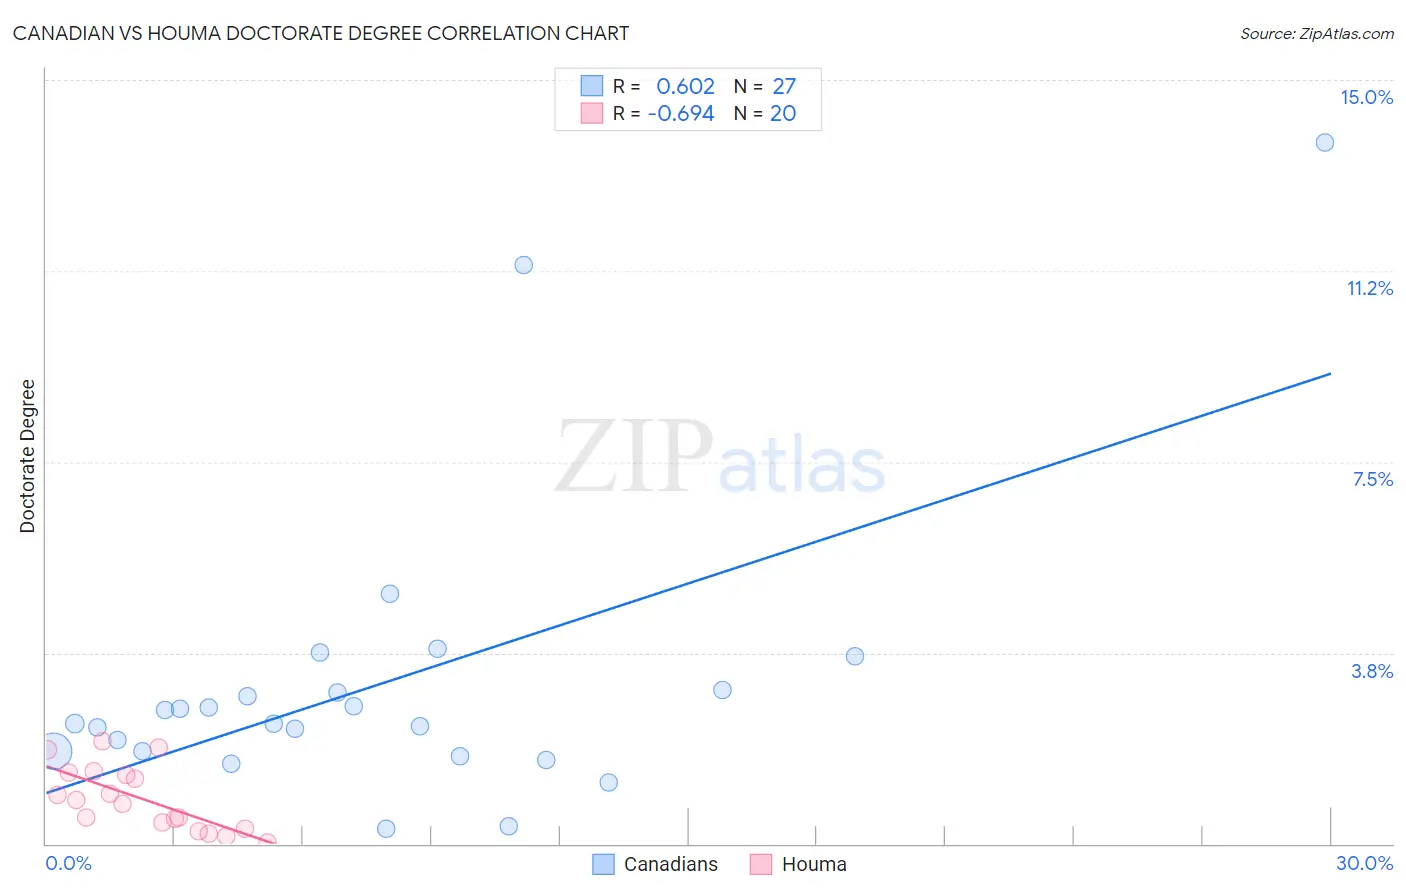
Canadian vs Houma Doctorate Degree Correlation Chart
The statistical analysis conducted on geographies consisting of 431,466,158 people shows a significant positive correlation between the proportion of Canadians and percentage of population with at least doctorate degree education in the United States with a correlation coefficient (R) of 0.602 and weighted average of 2.0%. Similarly, the statistical analysis conducted on geographies consisting of 36,552,567 people shows a significant negative correlation between the proportion of Houma and percentage of population with at least doctorate degree education in the United States with a correlation coefficient (R) of -0.694 and weighted average of 0.96%, a difference of 107.8%.
Doctorate Degree Correlation Summary
| Measurement | Canadian | Houma |
| Minimum | 0.28% | 0.036% |
| Maximum | 13.8% | 2.0% |
| Range | 13.5% | 2.0% |
| Mean | 3.1% | 0.88% |
| Median | 2.4% | 0.82% |
| Interquartile 25% (IQ1) | 1.8% | 0.35% |
| Interquartile 75% (IQ3) | 3.0% | 1.4% |
| Interquartile Range (IQR) | 1.2% | 1.0% |
| Standard Deviation (Sample) | 2.9% | 0.62% |
| Standard Deviation (Population) | 2.9% | 0.60% |
Similar Demographics by Doctorate Degree
Demographics Similar to Canadians by Doctorate Degree
In terms of doctorate degree, the demographic groups most similar to Canadians are Immigrants from Ukraine (2.0%, a difference of 0.010%), Immigrants from Sierra Leone (2.0%, a difference of 0.14%), Immigrants from Zaire (2.0%, a difference of 0.22%), Scottish (2.0%, a difference of 0.42%), and Immigrants from Uzbekistan (2.0%, a difference of 0.47%).
| Demographics | Rating | Rank | Doctorate Degree |
| Immigrants | Southern Europe | 94.7 /100 | #122 | Exceptional 2.0% |
| Croatians | 94.0 /100 | #123 | Exceptional 2.0% |
| Ute | 93.2 /100 | #124 | Exceptional 2.0% |
| Moroccans | 93.0 /100 | #125 | Exceptional 2.0% |
| Jordanians | 92.1 /100 | #126 | Exceptional 2.0% |
| Palestinians | 92.0 /100 | #127 | Exceptional 2.0% |
| Immigrants | Zaire | 91.1 /100 | #128 | Exceptional 2.0% |
| Canadians | 90.6 /100 | #129 | Exceptional 2.0% |
| Immigrants | Ukraine | 90.5 /100 | #130 | Exceptional 2.0% |
| Immigrants | Sierra Leone | 90.2 /100 | #131 | Exceptional 2.0% |
| Scottish | 89.4 /100 | #132 | Excellent 2.0% |
| Immigrants | Uzbekistan | 89.3 /100 | #133 | Excellent 2.0% |
| Immigrants | Cameroon | 88.9 /100 | #134 | Excellent 2.0% |
| Serbians | 88.7 /100 | #135 | Excellent 2.0% |
| Swedes | 88.3 /100 | #136 | Excellent 2.0% |
Demographics Similar to Houma by Doctorate Degree
In terms of doctorate degree, the demographic groups most similar to Houma are Spanish American Indian (1.1%, a difference of 10.5%), Lumbee (1.1%, a difference of 13.7%), Immigrants from Mexico (1.1%, a difference of 15.3%), Fijian (1.1%, a difference of 17.8%), and Arapaho (1.2%, a difference of 21.8%).
| Demographics | Rating | Rank | Doctorate Degree |
| Immigrants | Caribbean | 0.0 /100 | #333 | Tragic 1.3% |
| Immigrants | Dominican Republic | 0.0 /100 | #334 | Tragic 1.3% |
| Immigrants | Haiti | 0.0 /100 | #335 | Tragic 1.3% |
| Nepalese | 0.0 /100 | #336 | Tragic 1.3% |
| Bangladeshis | 0.0 /100 | #337 | Tragic 1.2% |
| Puget Sound Salish | 0.0 /100 | #338 | Tragic 1.2% |
| Immigrants | Central America | 0.0 /100 | #339 | Tragic 1.2% |
| Immigrants | Cuba | 0.0 /100 | #340 | Tragic 1.2% |
| Mexicans | 0.0 /100 | #341 | Tragic 1.2% |
| Arapaho | 0.0 /100 | #342 | Tragic 1.2% |
| Fijians | 0.0 /100 | #343 | Tragic 1.1% |
| Immigrants | Mexico | 0.0 /100 | #344 | Tragic 1.1% |
| Lumbee | 0.0 /100 | #345 | Tragic 1.1% |
| Spanish American Indians | 0.0 /100 | #346 | Tragic 1.1% |
| Houma | 0.0 /100 | #347 | Tragic 0.96% |