Canadian vs Alaskan Athabascan In Labor Force | Age 30-34
COMPARE
Canadian
Alaskan Athabascan
In Labor Force | Age 30-34
In Labor Force | Age 30-34 Comparison
Canadians
Alaskan Athabascans
84.4%
IN LABOR FORCE | AGE 30-34
15.4/ 100
METRIC RATING
203rd/ 347
METRIC RANK
81.7%
IN LABOR FORCE | AGE 30-34
0.0/ 100
METRIC RATING
314th/ 347
METRIC RANK
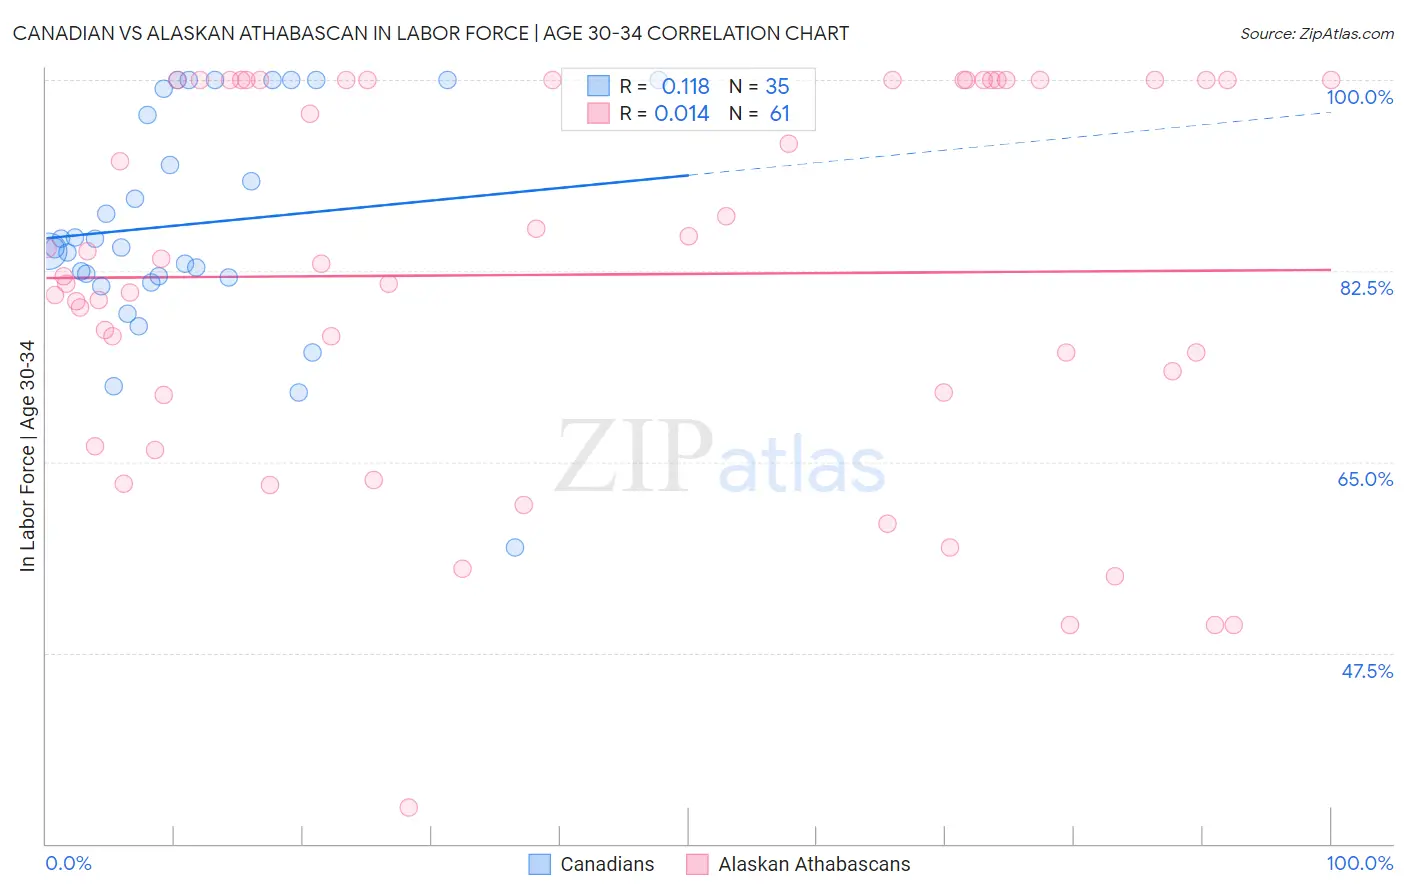
Canadian vs Alaskan Athabascan In Labor Force | Age 30-34 Correlation Chart
The statistical analysis conducted on geographies consisting of 437,189,359 people shows a poor positive correlation between the proportion of Canadians and labor force participation rate among population between the ages 30 and 34 in the United States with a correlation coefficient (R) of 0.118 and weighted average of 84.4%. Similarly, the statistical analysis conducted on geographies consisting of 45,811,893 people shows no correlation between the proportion of Alaskan Athabascans and labor force participation rate among population between the ages 30 and 34 in the United States with a correlation coefficient (R) of 0.014 and weighted average of 81.7%, a difference of 3.4%.
In Labor Force | Age 30-34 Correlation Summary
| Measurement | Canadian | Alaskan Athabascan |
| Minimum | 57.1% | 33.3% |
| Maximum | 100.0% | 100.0% |
| Range | 42.9% | 66.7% |
| Mean | 86.8% | 82.2% |
| Median | 84.6% | 83.2% |
| Interquartile 25% (IQ1) | 81.9% | 71.3% |
| Interquartile 75% (IQ3) | 99.2% | 100.0% |
| Interquartile Range (IQR) | 17.3% | 28.7% |
| Standard Deviation (Sample) | 10.2% | 17.3% |
| Standard Deviation (Population) | 10.1% | 17.2% |
Similar Demographics by In Labor Force | Age 30-34
Demographics Similar to Canadians by In Labor Force | Age 30-34
In terms of in labor force | age 30-34, the demographic groups most similar to Canadians are Ecuadorian (84.4%, a difference of 0.020%), French (84.4%, a difference of 0.020%), Trinidadian and Tobagonian (84.5%, a difference of 0.030%), Immigrants from West Indies (84.5%, a difference of 0.030%), and Subsaharan African (84.5%, a difference of 0.040%).
| Demographics | Rating | Rank | In Labor Force | Age 30-34 |
| British | 22.9 /100 | #196 | Fair 84.5% |
| Immigrants | Syria | 21.9 /100 | #197 | Fair 84.5% |
| Dutch | 20.2 /100 | #198 | Fair 84.5% |
| Immigrants | Thailand | 19.1 /100 | #199 | Poor 84.5% |
| Sub-Saharan Africans | 19.0 /100 | #200 | Poor 84.5% |
| Trinidadians and Tobagonians | 18.2 /100 | #201 | Poor 84.5% |
| Immigrants | West Indies | 18.1 /100 | #202 | Poor 84.5% |
| Canadians | 15.4 /100 | #203 | Poor 84.4% |
| Ecuadorians | 14.2 /100 | #204 | Poor 84.4% |
| French | 13.8 /100 | #205 | Poor 84.4% |
| Lebanese | 10.6 /100 | #206 | Poor 84.4% |
| Bangladeshis | 9.4 /100 | #207 | Tragic 84.3% |
| Arabs | 8.9 /100 | #208 | Tragic 84.3% |
| Jamaicans | 8.8 /100 | #209 | Tragic 84.3% |
| Indonesians | 8.8 /100 | #210 | Tragic 84.3% |
Demographics Similar to Alaskan Athabascans by In Labor Force | Age 30-34
In terms of in labor force | age 30-34, the demographic groups most similar to Alaskan Athabascans are Cherokee (81.6%, a difference of 0.10%), Iroquois (81.9%, a difference of 0.25%), Immigrants from the Azores (81.5%, a difference of 0.25%), Arapaho (81.5%, a difference of 0.26%), and Chickasaw (81.9%, a difference of 0.27%).
| Demographics | Rating | Rank | In Labor Force | Age 30-34 |
| Menominee | 0.0 /100 | #307 | Tragic 82.2% |
| Puget Sound Salish | 0.0 /100 | #308 | Tragic 82.1% |
| Immigrants | Mexico | 0.0 /100 | #309 | Tragic 82.0% |
| Cajuns | 0.0 /100 | #310 | Tragic 82.0% |
| Chickasaw | 0.0 /100 | #311 | Tragic 81.9% |
| Mexicans | 0.0 /100 | #312 | Tragic 81.9% |
| Iroquois | 0.0 /100 | #313 | Tragic 81.9% |
| Alaskan Athabascans | 0.0 /100 | #314 | Tragic 81.7% |
| Cherokee | 0.0 /100 | #315 | Tragic 81.6% |
| Immigrants | Azores | 0.0 /100 | #316 | Tragic 81.5% |
| Arapaho | 0.0 /100 | #317 | Tragic 81.5% |
| Choctaw | 0.0 /100 | #318 | Tragic 81.4% |
| Shoshone | 0.0 /100 | #319 | Tragic 81.4% |
| Yaqui | 0.0 /100 | #320 | Tragic 81.4% |
| Alaska Natives | 0.0 /100 | #321 | Tragic 81.3% |