Canadian vs Central American Indian In Labor Force | Age 30-34
COMPARE
Canadian
Central American Indian
In Labor Force | Age 30-34
In Labor Force | Age 30-34 Comparison
Canadians
Central American Indians
84.4%
IN LABOR FORCE | AGE 30-34
15.4/ 100
METRIC RATING
203rd/ 347
METRIC RANK
83.0%
IN LABOR FORCE | AGE 30-34
0.0/ 100
METRIC RATING
288th/ 347
METRIC RANK
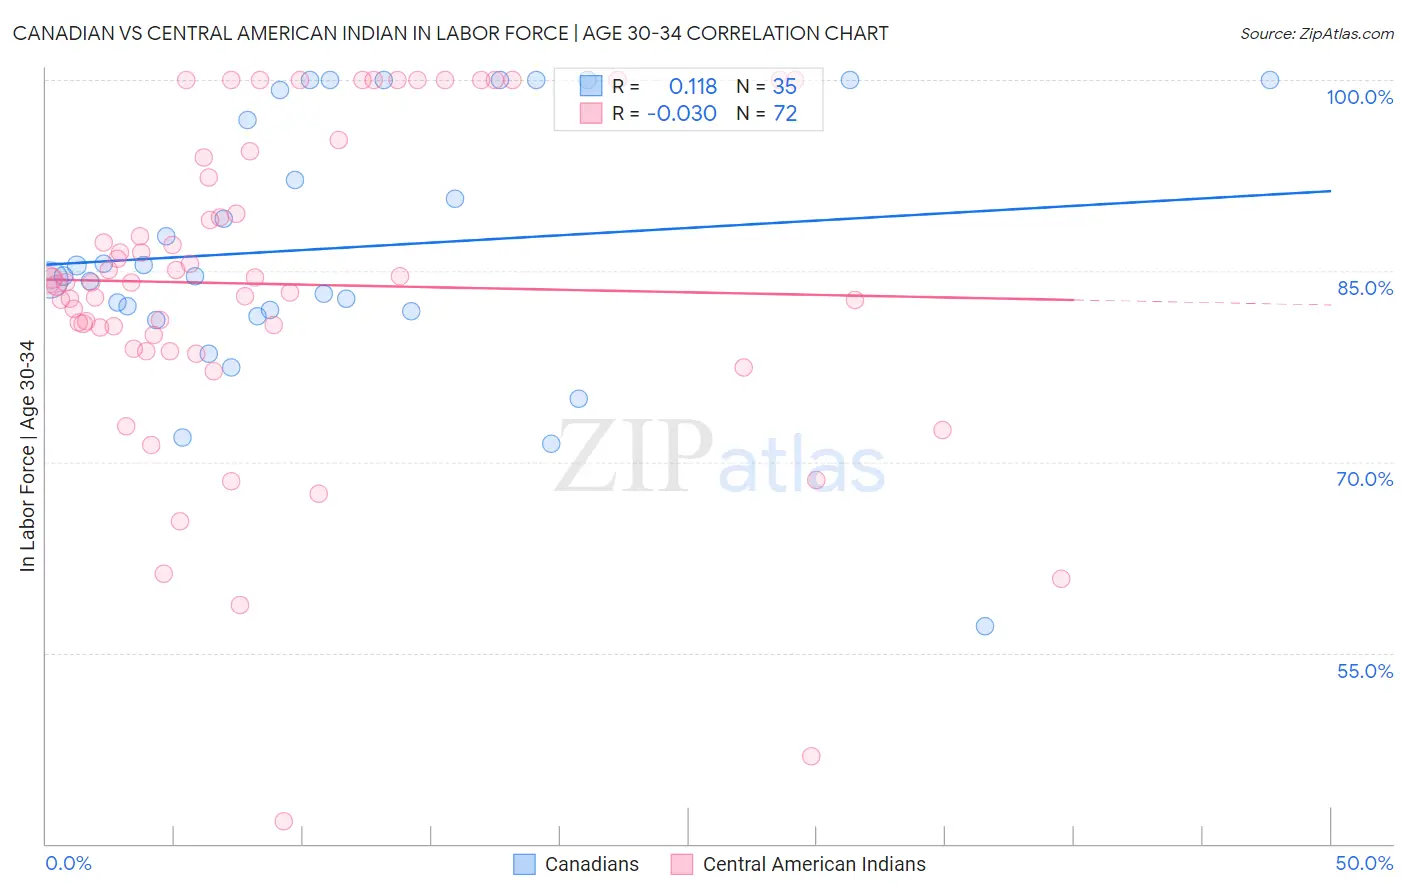
Canadian vs Central American Indian In Labor Force | Age 30-34 Correlation Chart
The statistical analysis conducted on geographies consisting of 437,189,359 people shows a poor positive correlation between the proportion of Canadians and labor force participation rate among population between the ages 30 and 34 in the United States with a correlation coefficient (R) of 0.118 and weighted average of 84.4%. Similarly, the statistical analysis conducted on geographies consisting of 326,063,674 people shows no correlation between the proportion of Central American Indians and labor force participation rate among population between the ages 30 and 34 in the United States with a correlation coefficient (R) of -0.030 and weighted average of 83.0%, a difference of 1.7%.
In Labor Force | Age 30-34 Correlation Summary
| Measurement | Canadian | Central American Indian |
| Minimum | 57.1% | 41.8% |
| Maximum | 100.0% | 100.0% |
| Range | 42.9% | 58.2% |
| Mean | 86.8% | 84.0% |
| Median | 84.6% | 84.1% |
| Interquartile 25% (IQ1) | 81.9% | 79.5% |
| Interquartile 75% (IQ3) | 99.2% | 93.1% |
| Interquartile Range (IQR) | 17.3% | 13.6% |
| Standard Deviation (Sample) | 10.2% | 12.5% |
| Standard Deviation (Population) | 10.1% | 12.4% |
Similar Demographics by In Labor Force | Age 30-34
Demographics Similar to Canadians by In Labor Force | Age 30-34
In terms of in labor force | age 30-34, the demographic groups most similar to Canadians are Ecuadorian (84.4%, a difference of 0.020%), French (84.4%, a difference of 0.020%), Trinidadian and Tobagonian (84.5%, a difference of 0.030%), Immigrants from West Indies (84.5%, a difference of 0.030%), and Subsaharan African (84.5%, a difference of 0.040%).
| Demographics | Rating | Rank | In Labor Force | Age 30-34 |
| British | 22.9 /100 | #196 | Fair 84.5% |
| Immigrants | Syria | 21.9 /100 | #197 | Fair 84.5% |
| Dutch | 20.2 /100 | #198 | Fair 84.5% |
| Immigrants | Thailand | 19.1 /100 | #199 | Poor 84.5% |
| Sub-Saharan Africans | 19.0 /100 | #200 | Poor 84.5% |
| Trinidadians and Tobagonians | 18.2 /100 | #201 | Poor 84.5% |
| Immigrants | West Indies | 18.1 /100 | #202 | Poor 84.5% |
| Canadians | 15.4 /100 | #203 | Poor 84.4% |
| Ecuadorians | 14.2 /100 | #204 | Poor 84.4% |
| French | 13.8 /100 | #205 | Poor 84.4% |
| Lebanese | 10.6 /100 | #206 | Poor 84.4% |
| Bangladeshis | 9.4 /100 | #207 | Tragic 84.3% |
| Arabs | 8.9 /100 | #208 | Tragic 84.3% |
| Jamaicans | 8.8 /100 | #209 | Tragic 84.3% |
| Indonesians | 8.8 /100 | #210 | Tragic 84.3% |
Demographics Similar to Central American Indians by In Labor Force | Age 30-34
In terms of in labor force | age 30-34, the demographic groups most similar to Central American Indians are Hawaiian (83.0%, a difference of 0.020%), Native Hawaiian (83.0%, a difference of 0.030%), Immigrants from Latin America (83.1%, a difference of 0.14%), Immigrants from Belize (83.2%, a difference of 0.20%), and Cree (83.2%, a difference of 0.20%).
| Demographics | Rating | Rank | In Labor Force | Age 30-34 |
| Samoans | 0.0 /100 | #281 | Tragic 83.3% |
| Mexican American Indians | 0.0 /100 | #282 | Tragic 83.2% |
| Assyrians/Chaldeans/Syriacs | 0.0 /100 | #283 | Tragic 83.2% |
| Immigrants | Belize | 0.0 /100 | #284 | Tragic 83.2% |
| Cree | 0.0 /100 | #285 | Tragic 83.2% |
| Immigrants | Latin America | 0.0 /100 | #286 | Tragic 83.1% |
| Native Hawaiians | 0.0 /100 | #287 | Tragic 83.0% |
| Central American Indians | 0.0 /100 | #288 | Tragic 83.0% |
| Hawaiians | 0.0 /100 | #289 | Tragic 83.0% |
| Blackfeet | 0.0 /100 | #290 | Tragic 82.8% |
| Potawatomi | 0.0 /100 | #291 | Tragic 82.8% |
| Blacks/African Americans | 0.0 /100 | #292 | Tragic 82.8% |
| Nepalese | 0.0 /100 | #293 | Tragic 82.7% |
| Americans | 0.0 /100 | #294 | Tragic 82.7% |
| Pennsylvania Germans | 0.0 /100 | #295 | Tragic 82.6% |