Cambodian vs Fijian In Labor Force | Age 20-64
COMPARE
Cambodian
Fijian
In Labor Force | Age 20-64
In Labor Force | Age 20-64 Comparison
Cambodians
Fijians
81.1%
IN LABOR FORCE | AGE 20-64
100.0/ 100
METRIC RATING
14th/ 347
METRIC RANK
78.4%
IN LABOR FORCE | AGE 20-64
0.1/ 100
METRIC RATING
262nd/ 347
METRIC RANK
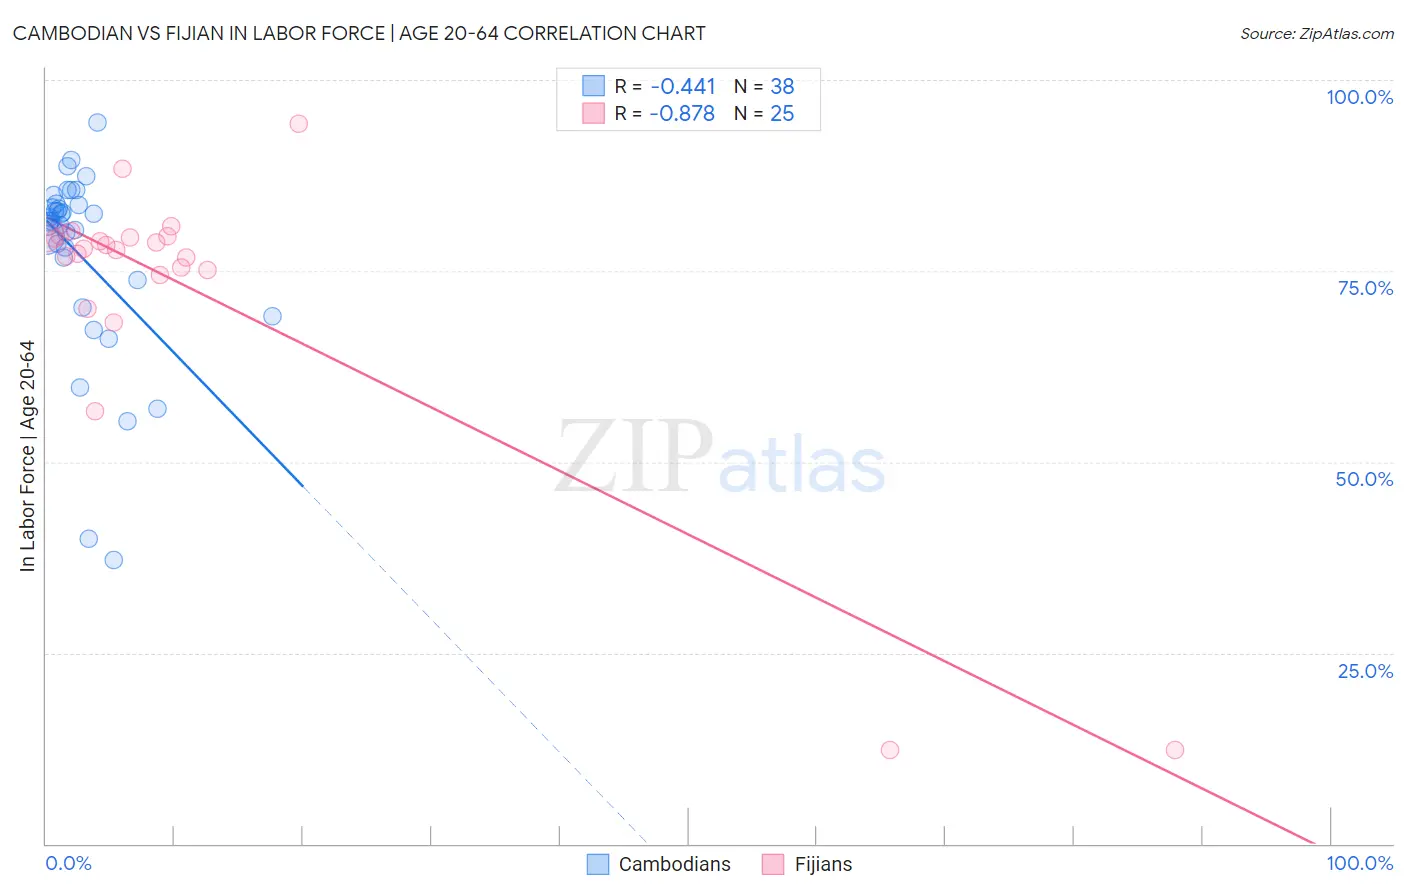
Cambodian vs Fijian In Labor Force | Age 20-64 Correlation Chart
The statistical analysis conducted on geographies consisting of 102,521,417 people shows a moderate negative correlation between the proportion of Cambodians and labor force participation rate among population between the ages 20 and 64 in the United States with a correlation coefficient (R) of -0.441 and weighted average of 81.1%. Similarly, the statistical analysis conducted on geographies consisting of 55,948,069 people shows a very strong negative correlation between the proportion of Fijians and labor force participation rate among population between the ages 20 and 64 in the United States with a correlation coefficient (R) of -0.878 and weighted average of 78.4%, a difference of 3.4%.
In Labor Force | Age 20-64 Correlation Summary
| Measurement | Cambodian | Fijian |
| Minimum | 37.1% | 12.2% |
| Maximum | 94.5% | 94.3% |
| Range | 57.4% | 82.1% |
| Mean | 77.0% | 72.3% |
| Median | 81.5% | 77.9% |
| Interquartile 25% (IQ1) | 73.8% | 74.8% |
| Interquartile 75% (IQ3) | 83.6% | 79.5% |
| Interquartile Range (IQR) | 9.8% | 4.7% |
| Standard Deviation (Sample) | 12.6% | 19.2% |
| Standard Deviation (Population) | 12.5% | 18.9% |
Similar Demographics by In Labor Force | Age 20-64
Demographics Similar to Cambodians by In Labor Force | Age 20-64
In terms of in labor force | age 20-64, the demographic groups most similar to Cambodians are Bulgarian (81.1%, a difference of 0.010%), Immigrants from Nepal (81.1%, a difference of 0.020%), Norwegian (81.0%, a difference of 0.12%), Immigrants from Bulgaria (81.0%, a difference of 0.13%), and Zimbabwean (81.0%, a difference of 0.14%).
| Demographics | Rating | Rank | In Labor Force | Age 20-64 |
| Immigrants | Cameroon | 100.0 /100 | #7 | Exceptional 81.6% |
| Immigrants | Somalia | 100.0 /100 | #8 | Exceptional 81.6% |
| Sierra Leoneans | 100.0 /100 | #9 | Exceptional 81.5% |
| Immigrants | Sierra Leone | 100.0 /100 | #10 | Exceptional 81.5% |
| Immigrants | Eastern Africa | 100.0 /100 | #11 | Exceptional 81.3% |
| Immigrants | Eritrea | 100.0 /100 | #12 | Exceptional 81.3% |
| Immigrants | India | 100.0 /100 | #13 | Exceptional 81.3% |
| Cambodians | 100.0 /100 | #14 | Exceptional 81.1% |
| Bulgarians | 100.0 /100 | #15 | Exceptional 81.1% |
| Immigrants | Nepal | 100.0 /100 | #16 | Exceptional 81.1% |
| Norwegians | 100.0 /100 | #17 | Exceptional 81.0% |
| Immigrants | Bulgaria | 100.0 /100 | #18 | Exceptional 81.0% |
| Zimbabweans | 100.0 /100 | #19 | Exceptional 81.0% |
| Thais | 100.0 /100 | #20 | Exceptional 80.9% |
| Liberians | 100.0 /100 | #21 | Exceptional 80.9% |
Demographics Similar to Fijians by In Labor Force | Age 20-64
In terms of in labor force | age 20-64, the demographic groups most similar to Fijians are Pennsylvania German (78.4%, a difference of 0.010%), Spaniard (78.4%, a difference of 0.020%), British West Indian (78.4%, a difference of 0.060%), Bahamian (78.4%, a difference of 0.060%), and U.S. Virgin Islander (78.4%, a difference of 0.080%).
| Demographics | Rating | Rank | In Labor Force | Age 20-64 |
| Hawaiians | 0.5 /100 | #255 | Tragic 78.7% |
| Celtics | 0.5 /100 | #256 | Tragic 78.7% |
| Guatemalans | 0.4 /100 | #257 | Tragic 78.7% |
| Immigrants | Guatemala | 0.4 /100 | #258 | Tragic 78.7% |
| Tsimshian | 0.4 /100 | #259 | Tragic 78.7% |
| Immigrants | Fiji | 0.3 /100 | #260 | Tragic 78.6% |
| Whites/Caucasians | 0.2 /100 | #261 | Tragic 78.5% |
| Fijians | 0.1 /100 | #262 | Tragic 78.4% |
| Pennsylvania Germans | 0.1 /100 | #263 | Tragic 78.4% |
| Spaniards | 0.1 /100 | #264 | Tragic 78.4% |
| British West Indians | 0.1 /100 | #265 | Tragic 78.4% |
| Bahamians | 0.1 /100 | #266 | Tragic 78.4% |
| U.S. Virgin Islanders | 0.1 /100 | #267 | Tragic 78.4% |
| West Indians | 0.0 /100 | #268 | Tragic 78.3% |
| Immigrants | Barbados | 0.0 /100 | #269 | Tragic 78.3% |