Cambodian vs Immigrants from Zaire In Labor Force | Age 20-64
COMPARE
Cambodian
Immigrants from Zaire
In Labor Force | Age 20-64
In Labor Force | Age 20-64 Comparison
Cambodians
Immigrants from Zaire
81.1%
IN LABOR FORCE | AGE 20-64
100.0/ 100
METRIC RATING
14th/ 347
METRIC RANK
79.9%
IN LABOR FORCE | AGE 20-64
88.6/ 100
METRIC RATING
130th/ 347
METRIC RANK
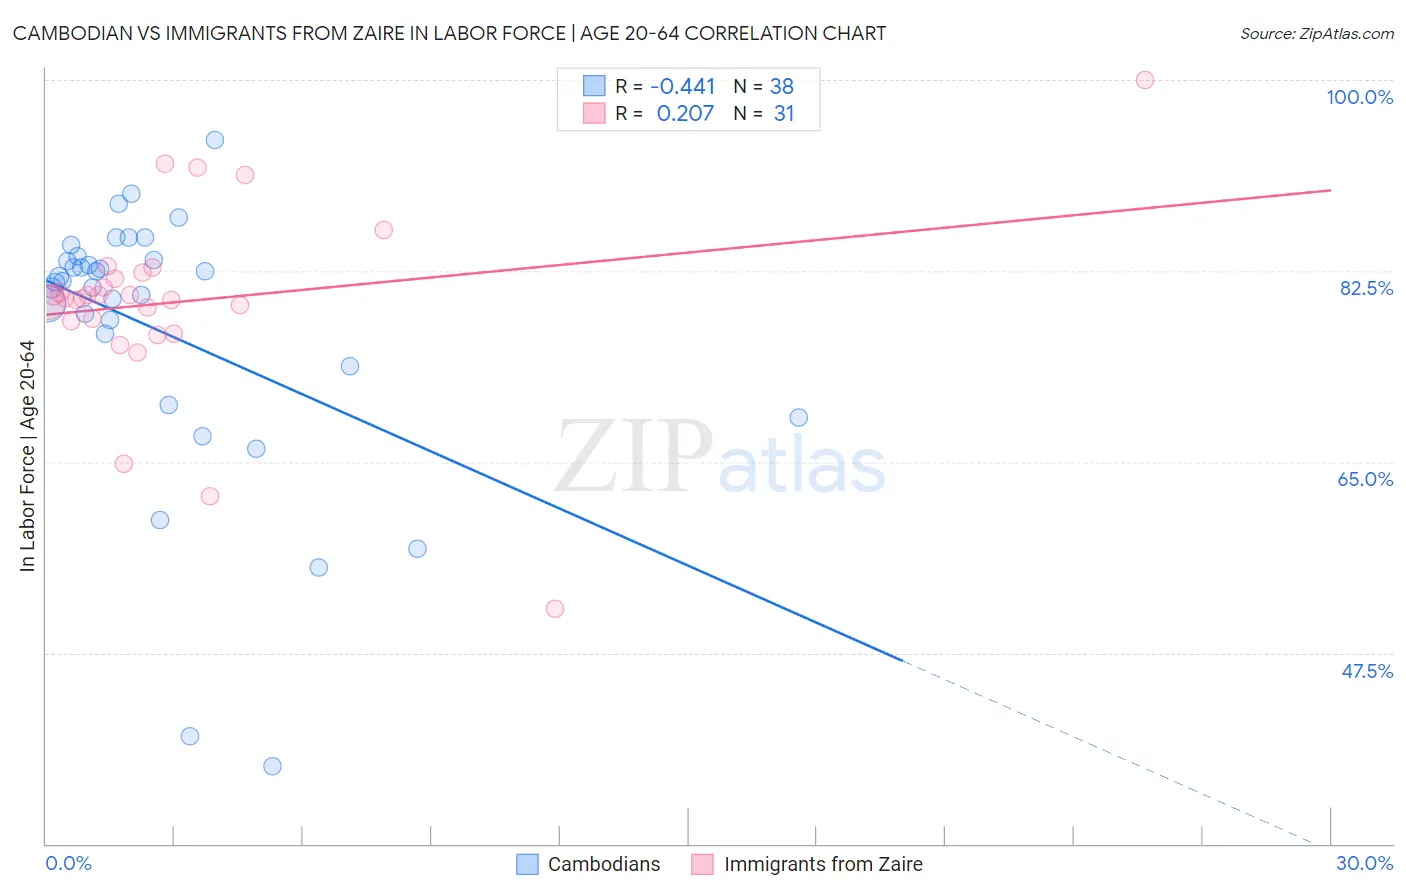
Cambodian vs Immigrants from Zaire In Labor Force | Age 20-64 Correlation Chart
The statistical analysis conducted on geographies consisting of 102,521,417 people shows a moderate negative correlation between the proportion of Cambodians and labor force participation rate among population between the ages 20 and 64 in the United States with a correlation coefficient (R) of -0.441 and weighted average of 81.1%. Similarly, the statistical analysis conducted on geographies consisting of 107,255,436 people shows a weak positive correlation between the proportion of Immigrants from Zaire and labor force participation rate among population between the ages 20 and 64 in the United States with a correlation coefficient (R) of 0.207 and weighted average of 79.9%, a difference of 1.5%.
In Labor Force | Age 20-64 Correlation Summary
| Measurement | Cambodian | Immigrants from Zaire |
| Minimum | 37.1% | 51.5% |
| Maximum | 94.5% | 100.0% |
| Range | 57.4% | 48.5% |
| Mean | 77.0% | 79.7% |
| Median | 81.5% | 80.0% |
| Interquartile 25% (IQ1) | 73.8% | 77.9% |
| Interquartile 75% (IQ3) | 83.6% | 82.4% |
| Interquartile Range (IQR) | 9.8% | 4.5% |
| Standard Deviation (Sample) | 12.6% | 8.8% |
| Standard Deviation (Population) | 12.5% | 8.7% |
Similar Demographics by In Labor Force | Age 20-64
Demographics Similar to Cambodians by In Labor Force | Age 20-64
In terms of in labor force | age 20-64, the demographic groups most similar to Cambodians are Bulgarian (81.1%, a difference of 0.010%), Immigrants from Nepal (81.1%, a difference of 0.020%), Norwegian (81.0%, a difference of 0.12%), Immigrants from Bulgaria (81.0%, a difference of 0.13%), and Zimbabwean (81.0%, a difference of 0.14%).
| Demographics | Rating | Rank | In Labor Force | Age 20-64 |
| Immigrants | Cameroon | 100.0 /100 | #7 | Exceptional 81.6% |
| Immigrants | Somalia | 100.0 /100 | #8 | Exceptional 81.6% |
| Sierra Leoneans | 100.0 /100 | #9 | Exceptional 81.5% |
| Immigrants | Sierra Leone | 100.0 /100 | #10 | Exceptional 81.5% |
| Immigrants | Eastern Africa | 100.0 /100 | #11 | Exceptional 81.3% |
| Immigrants | Eritrea | 100.0 /100 | #12 | Exceptional 81.3% |
| Immigrants | India | 100.0 /100 | #13 | Exceptional 81.3% |
| Cambodians | 100.0 /100 | #14 | Exceptional 81.1% |
| Bulgarians | 100.0 /100 | #15 | Exceptional 81.1% |
| Immigrants | Nepal | 100.0 /100 | #16 | Exceptional 81.1% |
| Norwegians | 100.0 /100 | #17 | Exceptional 81.0% |
| Immigrants | Bulgaria | 100.0 /100 | #18 | Exceptional 81.0% |
| Zimbabweans | 100.0 /100 | #19 | Exceptional 81.0% |
| Thais | 100.0 /100 | #20 | Exceptional 80.9% |
| Liberians | 100.0 /100 | #21 | Exceptional 80.9% |
Demographics Similar to Immigrants from Zaire by In Labor Force | Age 20-64
In terms of in labor force | age 20-64, the demographic groups most similar to Immigrants from Zaire are Italian (79.9%, a difference of 0.010%), Immigrants from Iran (79.9%, a difference of 0.010%), Immigrants from Czechoslovakia (79.9%, a difference of 0.020%), Immigrants from Eastern Asia (79.9%, a difference of 0.020%), and Indian (Asian) (79.9%, a difference of 0.020%).
| Demographics | Rating | Rank | In Labor Force | Age 20-64 |
| Immigrants | Russia | 91.8 /100 | #123 | Exceptional 79.9% |
| Immigrants | Europe | 91.6 /100 | #124 | Exceptional 79.9% |
| Danes | 91.5 /100 | #125 | Exceptional 79.9% |
| Immigrants | France | 90.7 /100 | #126 | Exceptional 79.9% |
| Immigrants | Czechoslovakia | 89.7 /100 | #127 | Excellent 79.9% |
| Immigrants | Eastern Asia | 89.4 /100 | #128 | Excellent 79.9% |
| Italians | 88.9 /100 | #129 | Excellent 79.9% |
| Immigrants | Zaire | 88.6 /100 | #130 | Excellent 79.9% |
| Immigrants | Iran | 88.3 /100 | #131 | Excellent 79.9% |
| Indians (Asian) | 87.7 /100 | #132 | Excellent 79.9% |
| South American Indians | 87.6 /100 | #133 | Excellent 79.9% |
| Belgians | 87.4 /100 | #134 | Excellent 79.9% |
| Ukrainians | 86.8 /100 | #135 | Excellent 79.9% |
| Immigrants | Singapore | 86.7 /100 | #136 | Excellent 79.9% |
| Immigrants | Ukraine | 86.5 /100 | #137 | Excellent 79.9% |