Cambodian vs Immigrants from North Macedonia In Labor Force | Age 25-29
COMPARE
Cambodian
Immigrants from North Macedonia
In Labor Force | Age 25-29
In Labor Force | Age 25-29 Comparison
Cambodians
Immigrants from North Macedonia
86.0%
IN LABOR FORCE | AGE 25-29
100.0/ 100
METRIC RATING
22nd/ 347
METRIC RANK
85.9%
IN LABOR FORCE | AGE 25-29
100.0/ 100
METRIC RATING
26th/ 347
METRIC RANK
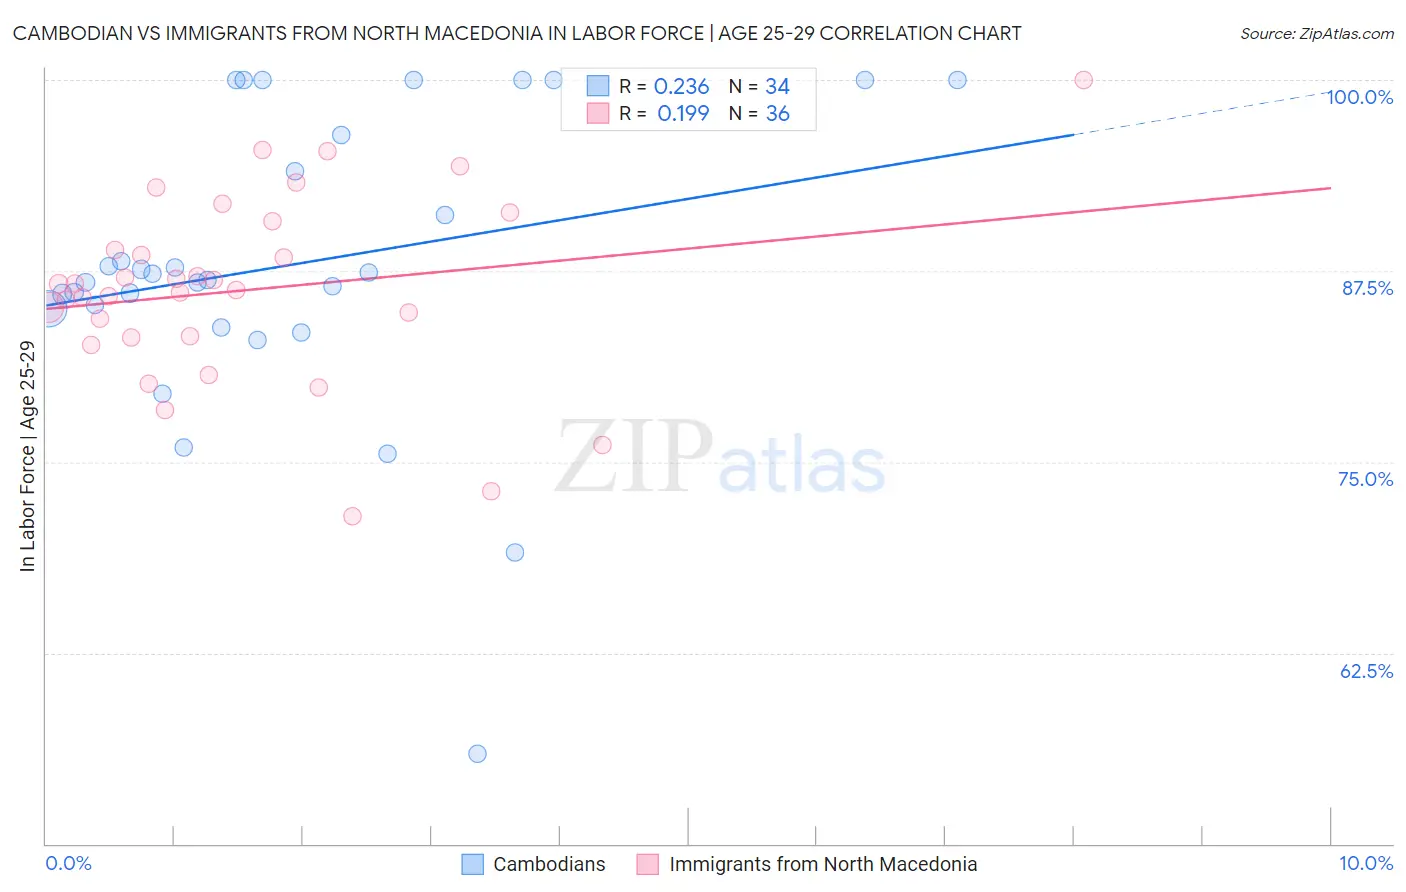
Cambodian vs Immigrants from North Macedonia In Labor Force | Age 25-29 Correlation Chart
The statistical analysis conducted on geographies consisting of 102,510,080 people shows a weak positive correlation between the proportion of Cambodians and labor force participation rate among population between the ages 25 and 29 in the United States with a correlation coefficient (R) of 0.236 and weighted average of 86.0%. Similarly, the statistical analysis conducted on geographies consisting of 74,314,976 people shows a poor positive correlation between the proportion of Immigrants from North Macedonia and labor force participation rate among population between the ages 25 and 29 in the United States with a correlation coefficient (R) of 0.199 and weighted average of 85.9%, a difference of 0.090%.
In Labor Force | Age 25-29 Correlation Summary
| Measurement | Cambodian | Immigrants from North Macedonia |
| Minimum | 55.9% | 71.4% |
| Maximum | 100.0% | 100.0% |
| Range | 44.1% | 28.6% |
| Mean | 87.9% | 86.3% |
| Median | 87.1% | 86.4% |
| Interquartile 25% (IQ1) | 85.0% | 83.2% |
| Interquartile 75% (IQ3) | 96.4% | 89.8% |
| Interquartile Range (IQR) | 11.3% | 6.6% |
| Standard Deviation (Sample) | 9.7% | 6.1% |
| Standard Deviation (Population) | 9.6% | 6.1% |
Demographics Similar to Cambodians and Immigrants from North Macedonia by In Labor Force | Age 25-29
In terms of in labor force | age 25-29, the demographic groups most similar to Cambodians are Maltese (86.0%, a difference of 0.010%), Immigrants from Ireland (86.0%, a difference of 0.020%), Immigrants from Uganda (86.0%, a difference of 0.020%), Immigrants from Eastern Africa (86.0%, a difference of 0.030%), and Bulgarian (86.0%, a difference of 0.040%). Similarly, the demographic groups most similar to Immigrants from North Macedonia are Paraguayan (85.9%, a difference of 0.010%), Ugandan (85.9%, a difference of 0.020%), Immigrants from Liberia (85.9%, a difference of 0.020%), Sudanese (85.9%, a difference of 0.060%), and Immigrants from Serbia (85.9%, a difference of 0.060%).
| Demographics | Rating | Rank | In Labor Force | Age 25-29 |
| Latvians | 100.0 /100 | #14 | Exceptional 86.1% |
| Bolivians | 100.0 /100 | #15 | Exceptional 86.1% |
| Immigrants | Bolivia | 100.0 /100 | #16 | Exceptional 86.1% |
| Bermudans | 100.0 /100 | #17 | Exceptional 86.0% |
| Bulgarians | 100.0 /100 | #18 | Exceptional 86.0% |
| Cape Verdeans | 100.0 /100 | #19 | Exceptional 86.0% |
| Immigrants | Ireland | 100.0 /100 | #20 | Exceptional 86.0% |
| Maltese | 100.0 /100 | #21 | Exceptional 86.0% |
| Cambodians | 100.0 /100 | #22 | Exceptional 86.0% |
| Immigrants | Uganda | 100.0 /100 | #23 | Exceptional 86.0% |
| Immigrants | Eastern Africa | 100.0 /100 | #24 | Exceptional 86.0% |
| Sudanese | 100.0 /100 | #25 | Exceptional 85.9% |
| Immigrants | North Macedonia | 100.0 /100 | #26 | Exceptional 85.9% |
| Paraguayans | 100.0 /100 | #27 | Exceptional 85.9% |
| Ugandans | 100.0 /100 | #28 | Exceptional 85.9% |
| Immigrants | Liberia | 100.0 /100 | #29 | Exceptional 85.9% |
| Immigrants | Serbia | 100.0 /100 | #30 | Exceptional 85.9% |
| German Russians | 100.0 /100 | #31 | Exceptional 85.8% |
| Slovaks | 100.0 /100 | #32 | Exceptional 85.8% |
| Immigrants | Bulgaria | 100.0 /100 | #33 | Exceptional 85.8% |
| Lithuanians | 99.9 /100 | #34 | Exceptional 85.8% |