Cambodian vs Choctaw 8th Grade
COMPARE
Cambodian
Choctaw
8th Grade
8th Grade Comparison
Cambodians
Choctaw
96.1%
8TH GRADE
90.6/ 100
METRIC RATING
137th/ 347
METRIC RANK
96.2%
8TH GRADE
94.0/ 100
METRIC RATING
126th/ 347
METRIC RANK
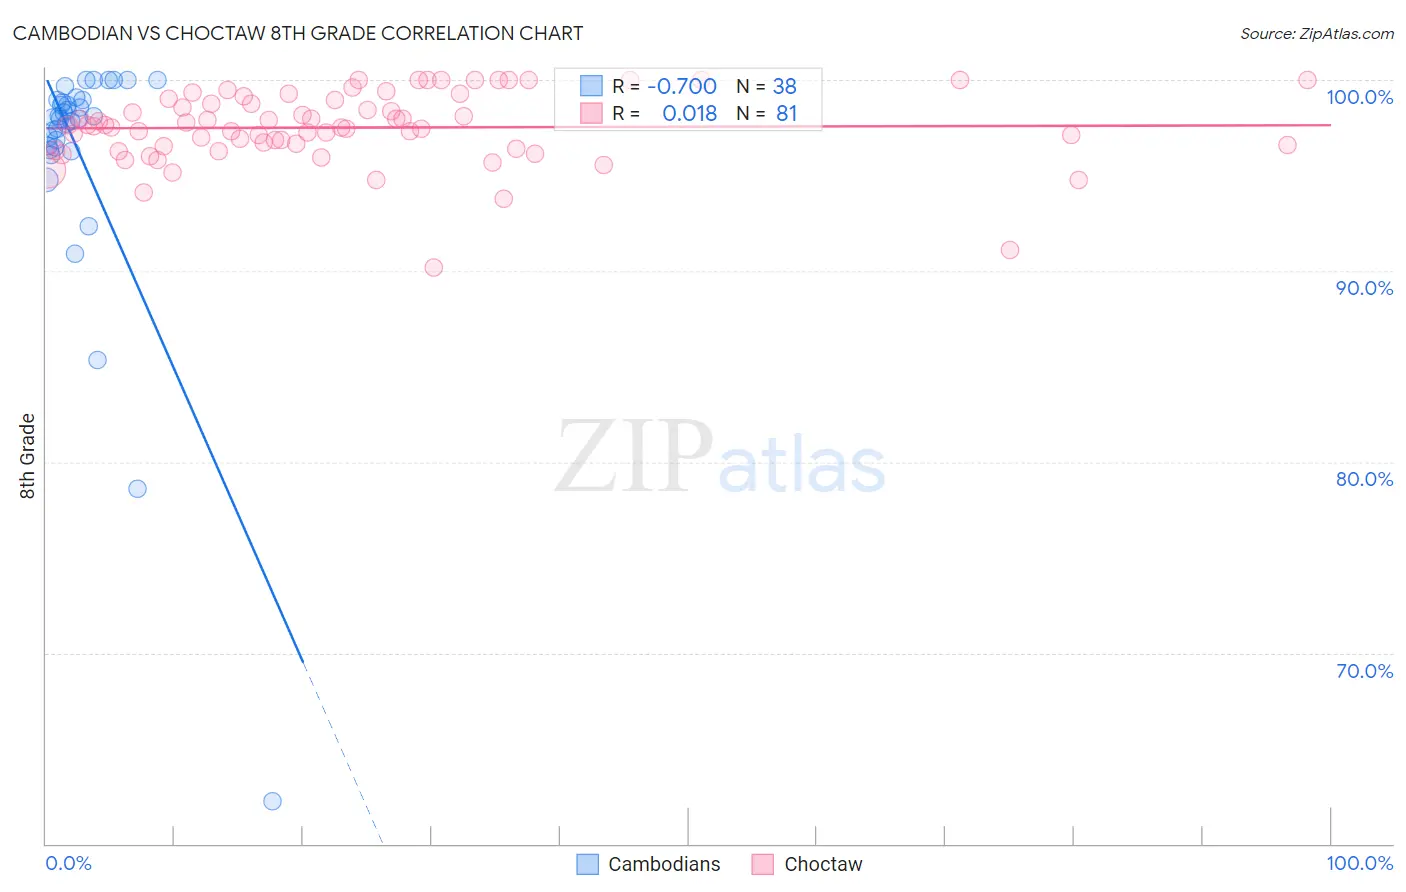
Cambodian vs Choctaw 8th Grade Correlation Chart
The statistical analysis conducted on geographies consisting of 102,514,976 people shows a significant negative correlation between the proportion of Cambodians and percentage of population with at least 8th grade education in the United States with a correlation coefficient (R) of -0.700 and weighted average of 96.1%. Similarly, the statistical analysis conducted on geographies consisting of 269,742,875 people shows no correlation between the proportion of Choctaw and percentage of population with at least 8th grade education in the United States with a correlation coefficient (R) of 0.018 and weighted average of 96.2%, a difference of 0.080%.
8th Grade Correlation Summary
| Measurement | Cambodian | Choctaw |
| Minimum | 62.2% | 90.2% |
| Maximum | 100.0% | 100.0% |
| Range | 37.8% | 9.8% |
| Mean | 96.0% | 97.5% |
| Median | 98.0% | 97.6% |
| Interquartile 25% (IQ1) | 96.5% | 96.5% |
| Interquartile 75% (IQ3) | 98.9% | 99.0% |
| Interquartile Range (IQR) | 2.5% | 2.5% |
| Standard Deviation (Sample) | 7.0% | 1.9% |
| Standard Deviation (Population) | 6.9% | 1.9% |
Demographics Similar to Cambodians and Choctaw by 8th Grade
In terms of 8th grade, the demographic groups most similar to Cambodians are Jordanian (96.1%, a difference of 0.010%), Burmese (96.1%, a difference of 0.010%), Immigrants from Turkey (96.1%, a difference of 0.020%), Immigrants from Hungary (96.1%, a difference of 0.020%), and Basque (96.1%, a difference of 0.020%). Similarly, the demographic groups most similar to Choctaw are Immigrants from Romania (96.2%, a difference of 0.0%), Immigrants from Serbia (96.2%, a difference of 0.0%), Immigrants from Bosnia and Herzegovina (96.2%, a difference of 0.0%), Filipino (96.2%, a difference of 0.020%), and Palestinian (96.2%, a difference of 0.020%).
| Demographics | Rating | Rank | 8th Grade |
| Immigrants | Bulgaria | 95.3 /100 | #121 | Exceptional 96.2% |
| Immigrants | Europe | 95.3 /100 | #122 | Exceptional 96.2% |
| Filipinos | 94.6 /100 | #123 | Exceptional 96.2% |
| Palestinians | 94.6 /100 | #124 | Exceptional 96.2% |
| Immigrants | Romania | 94.1 /100 | #125 | Exceptional 96.2% |
| Choctaw | 94.0 /100 | #126 | Exceptional 96.2% |
| Immigrants | Serbia | 94.0 /100 | #127 | Exceptional 96.2% |
| Immigrants | Bosnia and Herzegovina | 93.9 /100 | #128 | Exceptional 96.2% |
| Cheyenne | 93.3 /100 | #129 | Exceptional 96.1% |
| Soviet Union | 92.6 /100 | #130 | Exceptional 96.1% |
| Pueblo | 92.3 /100 | #131 | Exceptional 96.1% |
| Immigrants | Kuwait | 92.2 /100 | #132 | Exceptional 96.1% |
| Immigrants | Turkey | 91.7 /100 | #133 | Exceptional 96.1% |
| Immigrants | Hungary | 91.5 /100 | #134 | Exceptional 96.1% |
| Basques | 91.5 /100 | #135 | Exceptional 96.1% |
| Jordanians | 91.3 /100 | #136 | Exceptional 96.1% |
| Cambodians | 90.6 /100 | #137 | Exceptional 96.1% |
| Burmese | 90.2 /100 | #138 | Exceptional 96.1% |
| Hmong | 89.7 /100 | #139 | Excellent 96.1% |
| Immigrants | South Central Asia | 89.4 /100 | #140 | Excellent 96.1% |
| Immigrants | Greece | 85.9 /100 | #141 | Excellent 96.0% |