Cajun vs Argentinean In Labor Force | Age 25-29
COMPARE
Cajun
Argentinean
In Labor Force | Age 25-29
In Labor Force | Age 25-29 Comparison
Cajuns
Argentineans
82.5%
IN LABOR FORCE | AGE 25-29
0.0/ 100
METRIC RATING
307th/ 347
METRIC RANK
84.7%
IN LABOR FORCE | AGE 25-29
57.9/ 100
METRIC RATING
163rd/ 347
METRIC RANK
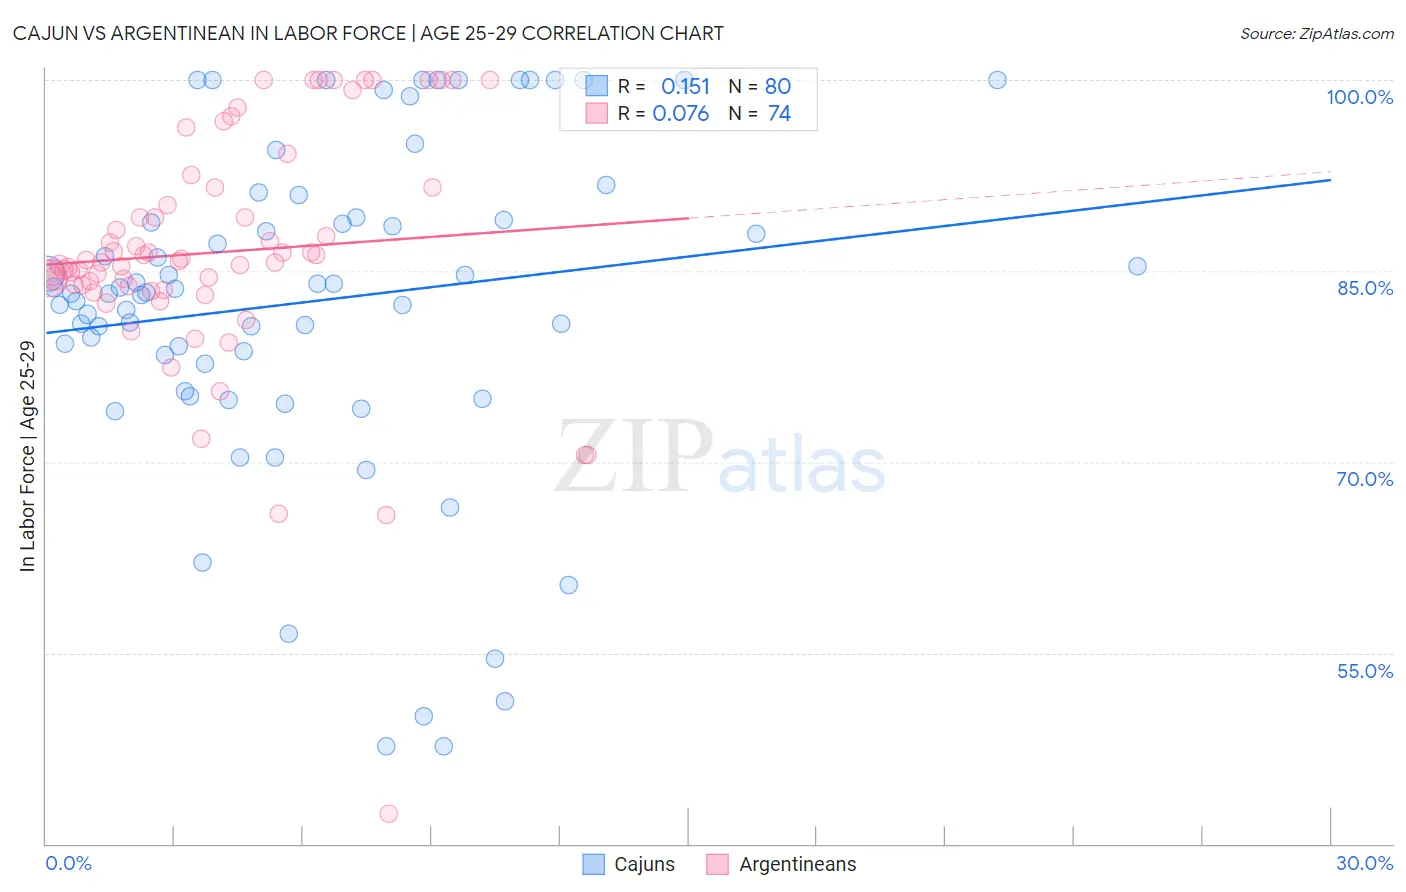
Cajun vs Argentinean In Labor Force | Age 25-29 Correlation Chart
The statistical analysis conducted on geographies consisting of 149,675,482 people shows a poor positive correlation between the proportion of Cajuns and labor force participation rate among population between the ages 25 and 29 in the United States with a correlation coefficient (R) of 0.151 and weighted average of 82.5%. Similarly, the statistical analysis conducted on geographies consisting of 297,081,391 people shows a slight positive correlation between the proportion of Argentineans and labor force participation rate among population between the ages 25 and 29 in the United States with a correlation coefficient (R) of 0.076 and weighted average of 84.7%, a difference of 2.6%.
In Labor Force | Age 25-29 Correlation Summary
| Measurement | Cajun | Argentinean |
| Minimum | 47.7% | 42.4% |
| Maximum | 100.0% | 100.0% |
| Range | 52.3% | 57.6% |
| Mean | 82.7% | 86.5% |
| Median | 83.4% | 85.7% |
| Interquartile 25% (IQ1) | 78.0% | 83.8% |
| Interquartile 75% (IQ3) | 90.1% | 91.6% |
| Interquartile Range (IQR) | 12.1% | 7.8% |
| Standard Deviation (Sample) | 13.1% | 9.5% |
| Standard Deviation (Population) | 13.0% | 9.5% |
Similar Demographics by In Labor Force | Age 25-29
Demographics Similar to Cajuns by In Labor Force | Age 25-29
In terms of in labor force | age 25-29, the demographic groups most similar to Cajuns are Black/African American (82.6%, a difference of 0.060%), Blackfeet (82.6%, a difference of 0.060%), Central American Indian (82.4%, a difference of 0.15%), Immigrants from Central America (82.4%, a difference of 0.16%), and Immigrants from St. Vincent and the Grenadines (82.7%, a difference of 0.18%).
| Demographics | Rating | Rank | In Labor Force | Age 25-29 |
| Spanish American Indians | 0.0 /100 | #300 | Tragic 82.9% |
| Vietnamese | 0.0 /100 | #301 | Tragic 82.8% |
| Immigrants | Belize | 0.0 /100 | #302 | Tragic 82.8% |
| Immigrants | Grenada | 0.0 /100 | #303 | Tragic 82.8% |
| Immigrants | St. Vincent and the Grenadines | 0.0 /100 | #304 | Tragic 82.7% |
| Blacks/African Americans | 0.0 /100 | #305 | Tragic 82.6% |
| Blackfeet | 0.0 /100 | #306 | Tragic 82.6% |
| Cajuns | 0.0 /100 | #307 | Tragic 82.5% |
| Central American Indians | 0.0 /100 | #308 | Tragic 82.4% |
| Immigrants | Central America | 0.0 /100 | #309 | Tragic 82.4% |
| Osage | 0.0 /100 | #310 | Tragic 82.3% |
| Alaskan Athabascans | 0.0 /100 | #311 | Tragic 82.3% |
| Hispanics or Latinos | 0.0 /100 | #312 | Tragic 82.2% |
| Yaqui | 0.0 /100 | #313 | Tragic 82.2% |
| Cherokee | 0.0 /100 | #314 | Tragic 82.1% |
Demographics Similar to Argentineans by In Labor Force | Age 25-29
In terms of in labor force | age 25-29, the demographic groups most similar to Argentineans are Canadian (84.7%, a difference of 0.0%), Immigrants from Colombia (84.7%, a difference of 0.0%), Ghanaian (84.7%, a difference of 0.0%), Immigrants from Burma/Myanmar (84.7%, a difference of 0.0%), and Immigrants from Peru (84.7%, a difference of 0.010%).
| Demographics | Rating | Rank | In Labor Force | Age 25-29 |
| French | 61.0 /100 | #156 | Good 84.7% |
| British | 60.4 /100 | #157 | Good 84.7% |
| Immigrants | Ghana | 60.2 /100 | #158 | Good 84.7% |
| Immigrants | Western Africa | 60.1 /100 | #159 | Good 84.7% |
| Immigrants | Peru | 58.6 /100 | #160 | Average 84.7% |
| Canadians | 58.5 /100 | #161 | Average 84.7% |
| Immigrants | Colombia | 58.3 /100 | #162 | Average 84.7% |
| Argentineans | 57.9 /100 | #163 | Average 84.7% |
| Ghanaians | 57.6 /100 | #164 | Average 84.7% |
| Immigrants | Burma/Myanmar | 57.4 /100 | #165 | Average 84.7% |
| Immigrants | Spain | 56.9 /100 | #166 | Average 84.7% |
| Indonesians | 56.5 /100 | #167 | Average 84.7% |
| South Americans | 54.9 /100 | #168 | Average 84.7% |
| Celtics | 52.5 /100 | #169 | Average 84.7% |
| Tongans | 52.4 /100 | #170 | Average 84.7% |