Cajun vs Immigrants from Eastern Africa In Labor Force | Age 35-44
COMPARE
Cajun
Immigrants from Eastern Africa
In Labor Force | Age 35-44
In Labor Force | Age 35-44 Comparison
Cajuns
Immigrants from Eastern Africa
81.5%
IN LABOR FORCE | AGE 35-44
0.0/ 100
METRIC RATING
314th/ 347
METRIC RANK
85.4%
IN LABOR FORCE | AGE 35-44
100.0/ 100
METRIC RATING
23rd/ 347
METRIC RANK
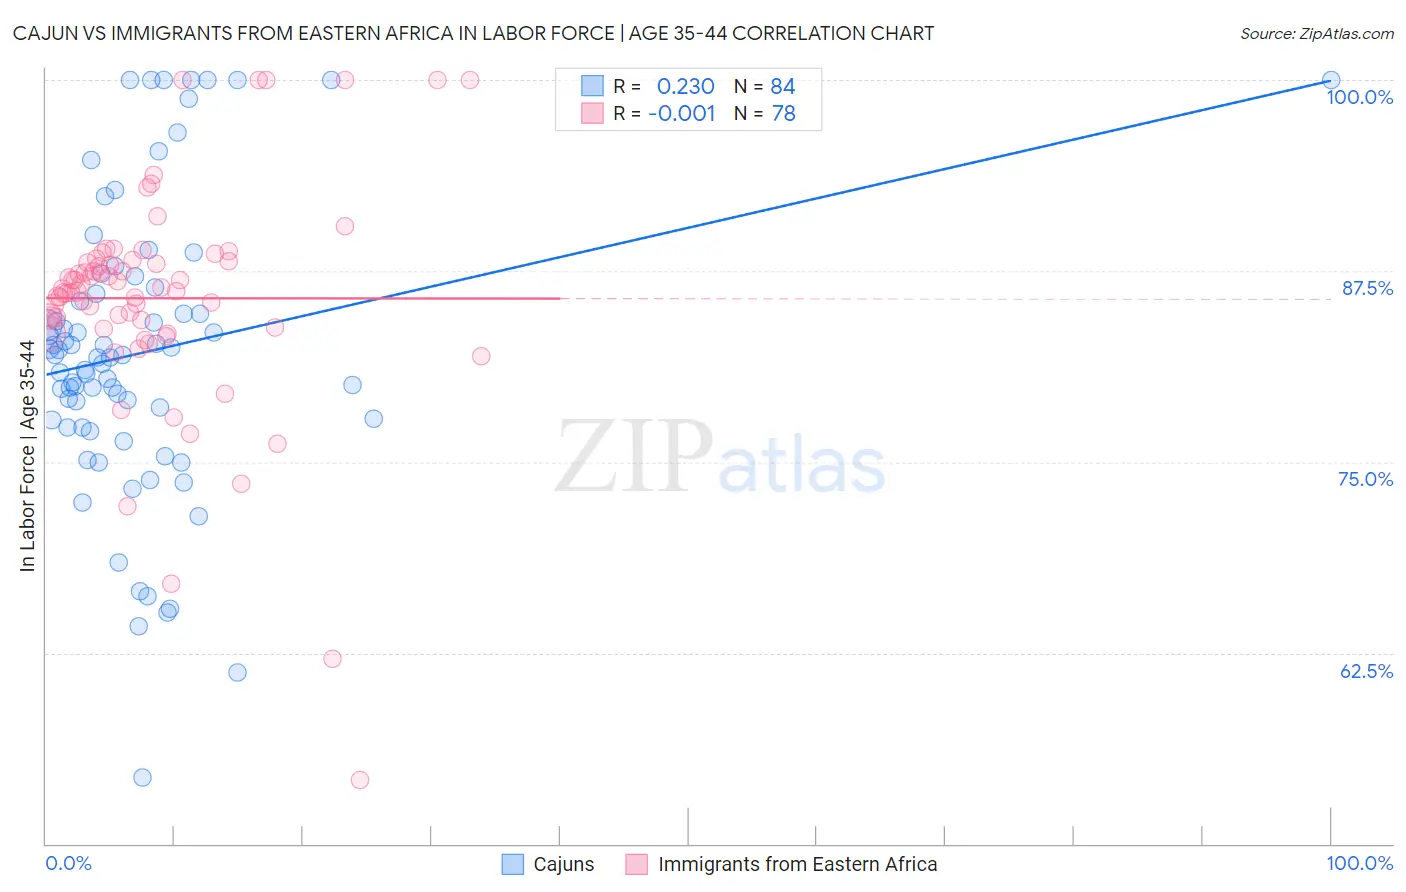
Cajun vs Immigrants from Eastern Africa In Labor Force | Age 35-44 Correlation Chart
The statistical analysis conducted on geographies consisting of 149,699,850 people shows a weak positive correlation between the proportion of Cajuns and labor force participation rate among population between the ages 35 and 44 in the United States with a correlation coefficient (R) of 0.230 and weighted average of 81.5%. Similarly, the statistical analysis conducted on geographies consisting of 354,984,376 people shows no correlation between the proportion of Immigrants from Eastern Africa and labor force participation rate among population between the ages 35 and 44 in the United States with a correlation coefficient (R) of -0.001 and weighted average of 85.4%, a difference of 4.8%.
In Labor Force | Age 35-44 Correlation Summary
| Measurement | Cajun | Immigrants from Eastern Africa |
| Minimum | 54.3% | 54.2% |
| Maximum | 100.0% | 100.0% |
| Range | 45.7% | 45.8% |
| Mean | 82.2% | 85.7% |
| Median | 81.9% | 86.2% |
| Interquartile 25% (IQ1) | 77.5% | 83.8% |
| Interquartile 75% (IQ3) | 86.2% | 88.1% |
| Interquartile Range (IQR) | 8.7% | 4.3% |
| Standard Deviation (Sample) | 9.5% | 7.4% |
| Standard Deviation (Population) | 9.5% | 7.4% |
Similar Demographics by In Labor Force | Age 35-44
Demographics Similar to Cajuns by In Labor Force | Age 35-44
In terms of in labor force | age 35-44, the demographic groups most similar to Cajuns are Immigrants from Mexico (81.5%, a difference of 0.020%), Comanche (81.5%, a difference of 0.050%), Mexican (81.6%, a difference of 0.11%), Alaska Native (81.6%, a difference of 0.12%), and Cherokee (81.4%, a difference of 0.13%).
| Demographics | Rating | Rank | In Labor Force | Age 35-44 |
| Hispanics or Latinos | 0.0 /100 | #307 | Tragic 82.1% |
| Immigrants | Central America | 0.0 /100 | #308 | Tragic 82.0% |
| Cree | 0.0 /100 | #309 | Tragic 82.0% |
| Blackfeet | 0.0 /100 | #310 | Tragic 81.9% |
| Colville | 0.0 /100 | #311 | Tragic 81.7% |
| Alaska Natives | 0.0 /100 | #312 | Tragic 81.6% |
| Mexicans | 0.0 /100 | #313 | Tragic 81.6% |
| Cajuns | 0.0 /100 | #314 | Tragic 81.5% |
| Immigrants | Mexico | 0.0 /100 | #315 | Tragic 81.5% |
| Comanche | 0.0 /100 | #316 | Tragic 81.5% |
| Cherokee | 0.0 /100 | #317 | Tragic 81.4% |
| Alaskan Athabascans | 0.0 /100 | #318 | Tragic 81.3% |
| Inupiat | 0.0 /100 | #319 | Tragic 80.9% |
| Chickasaw | 0.0 /100 | #320 | Tragic 80.9% |
| Puerto Ricans | 0.0 /100 | #321 | Tragic 80.7% |
Demographics Similar to Immigrants from Eastern Africa by In Labor Force | Age 35-44
In terms of in labor force | age 35-44, the demographic groups most similar to Immigrants from Eastern Africa are Immigrants from Bosnia and Herzegovina (85.4%, a difference of 0.020%), Bulgarian (85.5%, a difference of 0.060%), Latvian (85.4%, a difference of 0.060%), Paraguayan (85.4%, a difference of 0.070%), and Immigrants from Liberia (85.4%, a difference of 0.070%).
| Demographics | Rating | Rank | In Labor Force | Age 35-44 |
| Immigrants | Ireland | 100.0 /100 | #16 | Exceptional 85.6% |
| Immigrants | North Macedonia | 100.0 /100 | #17 | Exceptional 85.6% |
| Carpatho Rusyns | 100.0 /100 | #18 | Exceptional 85.6% |
| Slovenes | 100.0 /100 | #19 | Exceptional 85.6% |
| Immigrants | Serbia | 100.0 /100 | #20 | Exceptional 85.5% |
| Bulgarians | 100.0 /100 | #21 | Exceptional 85.5% |
| Immigrants | Bosnia and Herzegovina | 100.0 /100 | #22 | Exceptional 85.4% |
| Immigrants | Eastern Africa | 100.0 /100 | #23 | Exceptional 85.4% |
| Latvians | 99.9 /100 | #24 | Exceptional 85.4% |
| Paraguayans | 99.9 /100 | #25 | Exceptional 85.4% |
| Immigrants | Liberia | 99.9 /100 | #26 | Exceptional 85.4% |
| Immigrants | Lithuania | 99.9 /100 | #27 | Exceptional 85.4% |
| Immigrants | Greece | 99.9 /100 | #28 | Exceptional 85.3% |
| Cambodians | 99.9 /100 | #29 | Exceptional 85.3% |
| Bermudans | 99.9 /100 | #30 | Exceptional 85.3% |