Cajun vs Bolivian Seniors Poverty Over the Age of 65
COMPARE
Cajun
Bolivian
Seniors Poverty Over the Age of 65
Seniors Poverty Over the Age of 65 Comparison
Cajuns
Bolivians
11.9%
SENIORS POVERTY OVER THE AGE OF 65
2.0/ 100
METRIC RATING
231st/ 347
METRIC RANK
9.8%
SENIORS POVERTY OVER THE AGE OF 65
99.1/ 100
METRIC RATING
57th/ 347
METRIC RANK
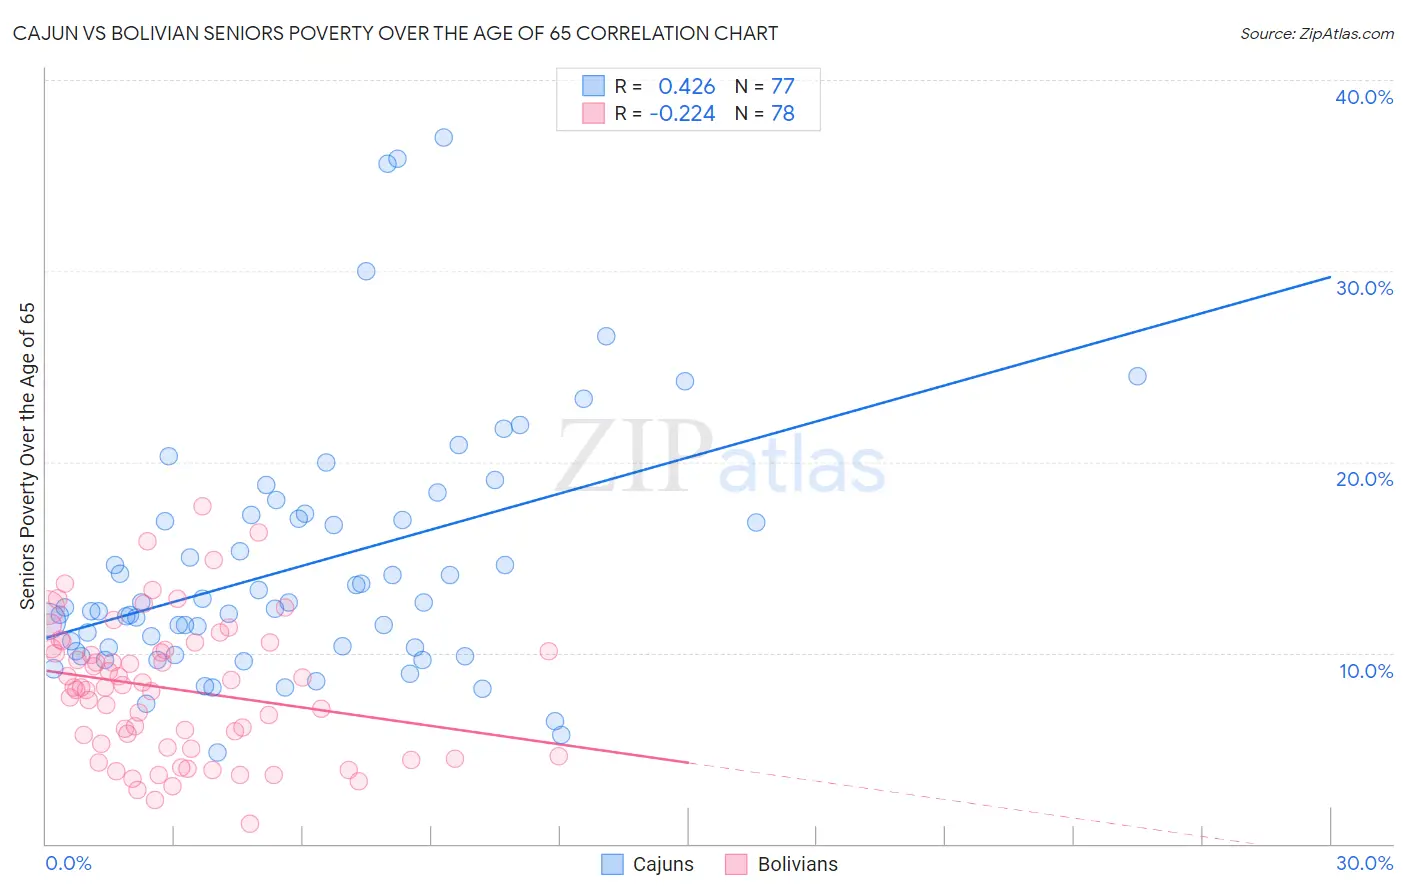
Cajun vs Bolivian Seniors Poverty Over the Age of 65 Correlation Chart
The statistical analysis conducted on geographies consisting of 149,395,455 people shows a moderate positive correlation between the proportion of Cajuns and poverty level among seniors over the age of 65 in the United States with a correlation coefficient (R) of 0.426 and weighted average of 11.9%. Similarly, the statistical analysis conducted on geographies consisting of 184,345,145 people shows a weak negative correlation between the proportion of Bolivians and poverty level among seniors over the age of 65 in the United States with a correlation coefficient (R) of -0.224 and weighted average of 9.8%, a difference of 21.2%.
Seniors Poverty Over the Age of 65 Correlation Summary
| Measurement | Cajun | Bolivian |
| Minimum | 4.8% | 1.0% |
| Maximum | 37.0% | 17.7% |
| Range | 32.2% | 16.7% |
| Mean | 14.5% | 8.1% |
| Median | 12.4% | 8.2% |
| Interquartile 25% (IQ1) | 10.2% | 5.0% |
| Interquartile 75% (IQ3) | 17.1% | 10.2% |
| Interquartile Range (IQR) | 6.9% | 5.2% |
| Standard Deviation (Sample) | 6.6% | 3.6% |
| Standard Deviation (Population) | 6.6% | 3.5% |
Similar Demographics by Seniors Poverty Over the Age of 65
Demographics Similar to Cajuns by Seniors Poverty Over the Age of 65
In terms of seniors poverty over the age of 65, the demographic groups most similar to Cajuns are Bermudan (11.9%, a difference of 0.050%), Yaqui (11.9%, a difference of 0.14%), Panamanian (11.9%, a difference of 0.24%), Iroquois (11.9%, a difference of 0.33%), and Immigrants from Eritrea (11.8%, a difference of 0.55%).
| Demographics | Rating | Rank | Seniors Poverty Over the Age of 65 |
| Immigrants | Nigeria | 3.4 /100 | #224 | Tragic 11.7% |
| Immigrants | Belarus | 3.2 /100 | #225 | Tragic 11.8% |
| Liberians | 3.2 /100 | #226 | Tragic 11.8% |
| Nigerians | 3.2 /100 | #227 | Tragic 11.8% |
| Immigrants | Costa Rica | 2.7 /100 | #228 | Tragic 11.8% |
| Immigrants | Eritrea | 2.6 /100 | #229 | Tragic 11.8% |
| Bermudans | 2.1 /100 | #230 | Tragic 11.9% |
| Cajuns | 2.0 /100 | #231 | Tragic 11.9% |
| Yaqui | 1.9 /100 | #232 | Tragic 11.9% |
| Panamanians | 1.8 /100 | #233 | Tragic 11.9% |
| Iroquois | 1.7 /100 | #234 | Tragic 11.9% |
| Immigrants | Argentina | 1.3 /100 | #235 | Tragic 12.0% |
| Immigrants | Peru | 1.3 /100 | #236 | Tragic 12.0% |
| Moroccans | 1.2 /100 | #237 | Tragic 12.0% |
| Seminole | 1.1 /100 | #238 | Tragic 12.0% |
Demographics Similar to Bolivians by Seniors Poverty Over the Age of 65
In terms of seniors poverty over the age of 65, the demographic groups most similar to Bolivians are Serbian (9.8%, a difference of 0.060%), Immigrants from England (9.8%, a difference of 0.12%), Immigrants from Canada (9.8%, a difference of 0.21%), Afghan (9.8%, a difference of 0.24%), and Celtic (9.8%, a difference of 0.25%).
| Demographics | Rating | Rank | Seniors Poverty Over the Age of 65 |
| Hungarians | 99.4 /100 | #50 | Exceptional 9.7% |
| Carpatho Rusyns | 99.3 /100 | #51 | Exceptional 9.7% |
| Filipinos | 99.3 /100 | #52 | Exceptional 9.7% |
| Slavs | 99.2 /100 | #53 | Exceptional 9.8% |
| Immigrants | Northern Europe | 99.2 /100 | #54 | Exceptional 9.8% |
| Afghans | 99.2 /100 | #55 | Exceptional 9.8% |
| Immigrants | England | 99.1 /100 | #56 | Exceptional 9.8% |
| Bolivians | 99.1 /100 | #57 | Exceptional 9.8% |
| Serbians | 99.1 /100 | #58 | Exceptional 9.8% |
| Immigrants | Canada | 99.0 /100 | #59 | Exceptional 9.8% |
| Celtics | 99.0 /100 | #60 | Exceptional 9.8% |
| Iranians | 98.9 /100 | #61 | Exceptional 9.8% |
| French Canadians | 98.9 /100 | #62 | Exceptional 9.8% |
| Macedonians | 98.8 /100 | #63 | Exceptional 9.9% |
| Immigrants | North America | 98.8 /100 | #64 | Exceptional 9.9% |