British vs Immigrants from North America In Labor Force | Age 20-64
COMPARE
British
Immigrants from North America
In Labor Force | Age 20-64
In Labor Force | Age 20-64 Comparison
British
Immigrants from North America
79.3%
IN LABOR FORCE | AGE 20-64
16.5/ 100
METRIC RATING
208th/ 347
METRIC RANK
79.0%
IN LABOR FORCE | AGE 20-64
2.9/ 100
METRIC RATING
237th/ 347
METRIC RANK
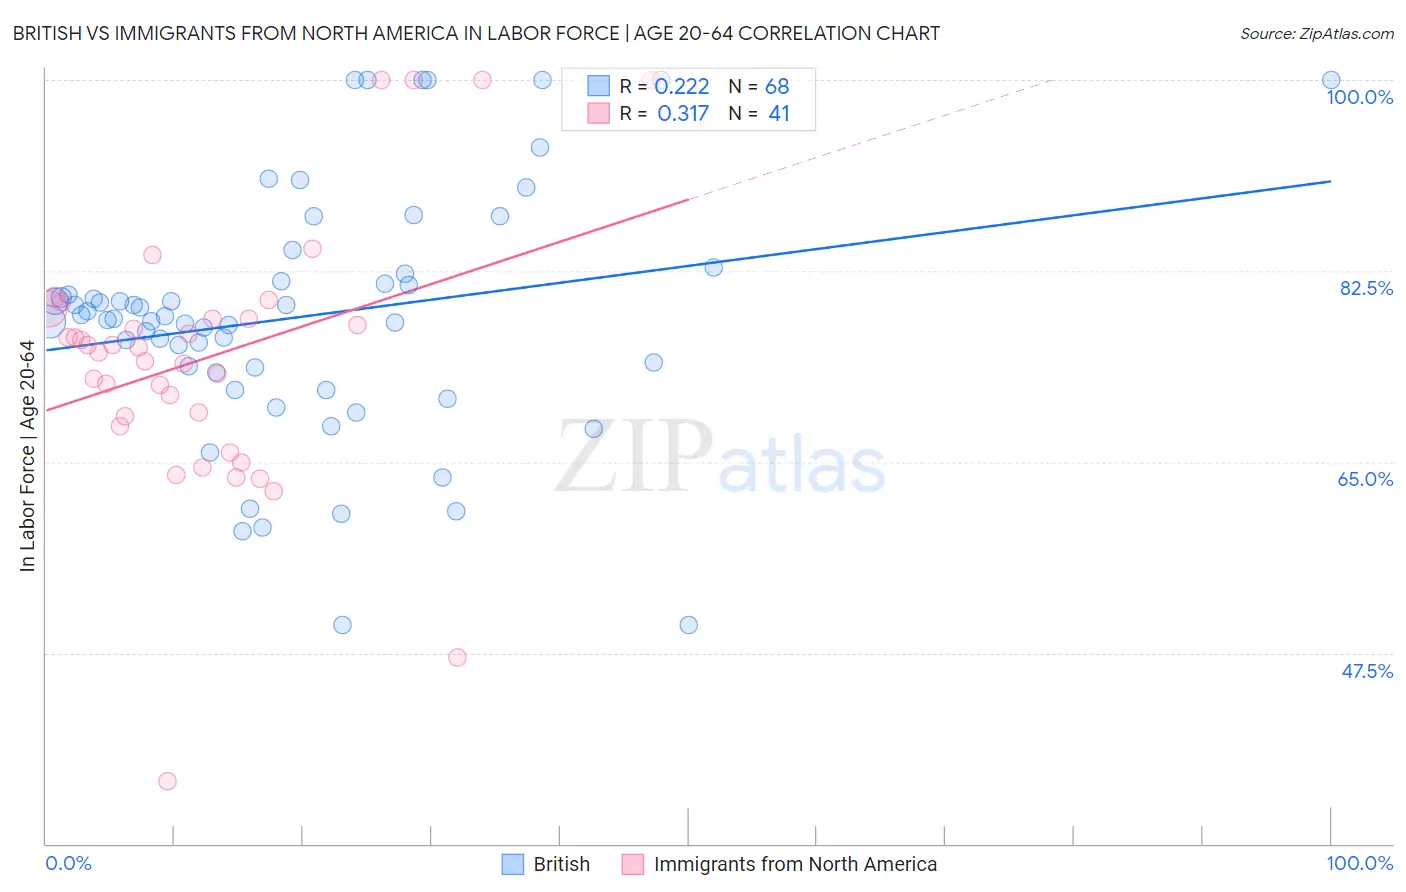
British vs Immigrants from North America In Labor Force | Age 20-64 Correlation Chart
The statistical analysis conducted on geographies consisting of 531,500,819 people shows a weak positive correlation between the proportion of British and labor force participation rate among population between the ages 20 and 64 in the United States with a correlation coefficient (R) of 0.222 and weighted average of 79.3%. Similarly, the statistical analysis conducted on geographies consisting of 462,473,604 people shows a mild positive correlation between the proportion of Immigrants from North America and labor force participation rate among population between the ages 20 and 64 in the United States with a correlation coefficient (R) of 0.317 and weighted average of 79.0%, a difference of 0.38%.
In Labor Force | Age 20-64 Correlation Summary
| Measurement | British | Immigrants from North America |
| Minimum | 50.0% | 35.8% |
| Maximum | 100.0% | 100.0% |
| Range | 50.0% | 64.2% |
| Mean | 78.3% | 74.5% |
| Median | 78.2% | 75.5% |
| Interquartile 25% (IQ1) | 73.4% | 68.7% |
| Interquartile 75% (IQ3) | 81.9% | 78.6% |
| Interquartile Range (IQR) | 8.6% | 9.8% |
| Standard Deviation (Sample) | 11.4% | 12.3% |
| Standard Deviation (Population) | 11.3% | 12.2% |
Similar Demographics by In Labor Force | Age 20-64
Demographics Similar to British by In Labor Force | Age 20-64
In terms of in labor force | age 20-64, the demographic groups most similar to British are Subsaharan African (79.3%, a difference of 0.0%), Bangladeshi (79.3%, a difference of 0.0%), Immigrants from Ecuador (79.3%, a difference of 0.010%), Haitian (79.3%, a difference of 0.010%), and Iraqi (79.3%, a difference of 0.020%).
| Demographics | Rating | Rank | In Labor Force | Age 20-64 |
| Immigrants | Nicaragua | 19.0 /100 | #201 | Poor 79.3% |
| Nicaraguans | 18.3 /100 | #202 | Poor 79.3% |
| Iraqis | 17.7 /100 | #203 | Poor 79.3% |
| Immigrants | Cambodia | 17.6 /100 | #204 | Poor 79.3% |
| Immigrants | Congo | 17.5 /100 | #205 | Poor 79.3% |
| Immigrants | Ecuador | 16.9 /100 | #206 | Poor 79.3% |
| Sub-Saharan Africans | 16.5 /100 | #207 | Poor 79.3% |
| British | 16.5 /100 | #208 | Poor 79.3% |
| Bangladeshis | 16.4 /100 | #209 | Poor 79.3% |
| Haitians | 16.1 /100 | #210 | Poor 79.3% |
| Europeans | 15.3 /100 | #211 | Poor 79.3% |
| Irish | 13.2 /100 | #212 | Poor 79.3% |
| Immigrants | Portugal | 12.8 /100 | #213 | Poor 79.3% |
| Immigrants | Armenia | 12.2 /100 | #214 | Poor 79.2% |
| Immigrants | Norway | 12.0 /100 | #215 | Poor 79.2% |
Demographics Similar to Immigrants from North America by In Labor Force | Age 20-64
In terms of in labor force | age 20-64, the demographic groups most similar to Immigrants from North America are Samoan (79.0%, a difference of 0.0%), Immigrants from Canada (79.0%, a difference of 0.020%), Tlingit-Haida (79.0%, a difference of 0.020%), Immigrants from Jamaica (79.0%, a difference of 0.020%), and Welsh (79.0%, a difference of 0.040%).
| Demographics | Rating | Rank | In Labor Force | Age 20-64 |
| Native Hawaiians | 5.6 /100 | #230 | Tragic 79.1% |
| Lebanese | 5.1 /100 | #231 | Tragic 79.1% |
| Guamanians/Chamorros | 4.5 /100 | #232 | Tragic 79.1% |
| Japanese | 4.0 /100 | #233 | Tragic 79.1% |
| Immigrants | Canada | 3.2 /100 | #234 | Tragic 79.0% |
| Tlingit-Haida | 3.2 /100 | #235 | Tragic 79.0% |
| Samoans | 2.9 /100 | #236 | Tragic 79.0% |
| Immigrants | North America | 2.9 /100 | #237 | Tragic 79.0% |
| Immigrants | Jamaica | 2.6 /100 | #238 | Tragic 79.0% |
| Welsh | 2.4 /100 | #239 | Tragic 79.0% |
| Trinidadians and Tobagonians | 2.3 /100 | #240 | Tragic 79.0% |
| Jamaicans | 2.0 /100 | #241 | Tragic 78.9% |
| Immigrants | Micronesia | 1.9 /100 | #242 | Tragic 78.9% |
| Immigrants | West Indies | 1.7 /100 | #243 | Tragic 78.9% |
| French | 1.5 /100 | #244 | Tragic 78.9% |