British vs Immigrants from Ghana In Labor Force | Age 20-64
COMPARE
British
Immigrants from Ghana
In Labor Force | Age 20-64
In Labor Force | Age 20-64 Comparison
British
Immigrants from Ghana
79.3%
IN LABOR FORCE | AGE 20-64
16.5/ 100
METRIC RATING
208th/ 347
METRIC RANK
80.0%
IN LABOR FORCE | AGE 20-64
95.0/ 100
METRIC RATING
105th/ 347
METRIC RANK
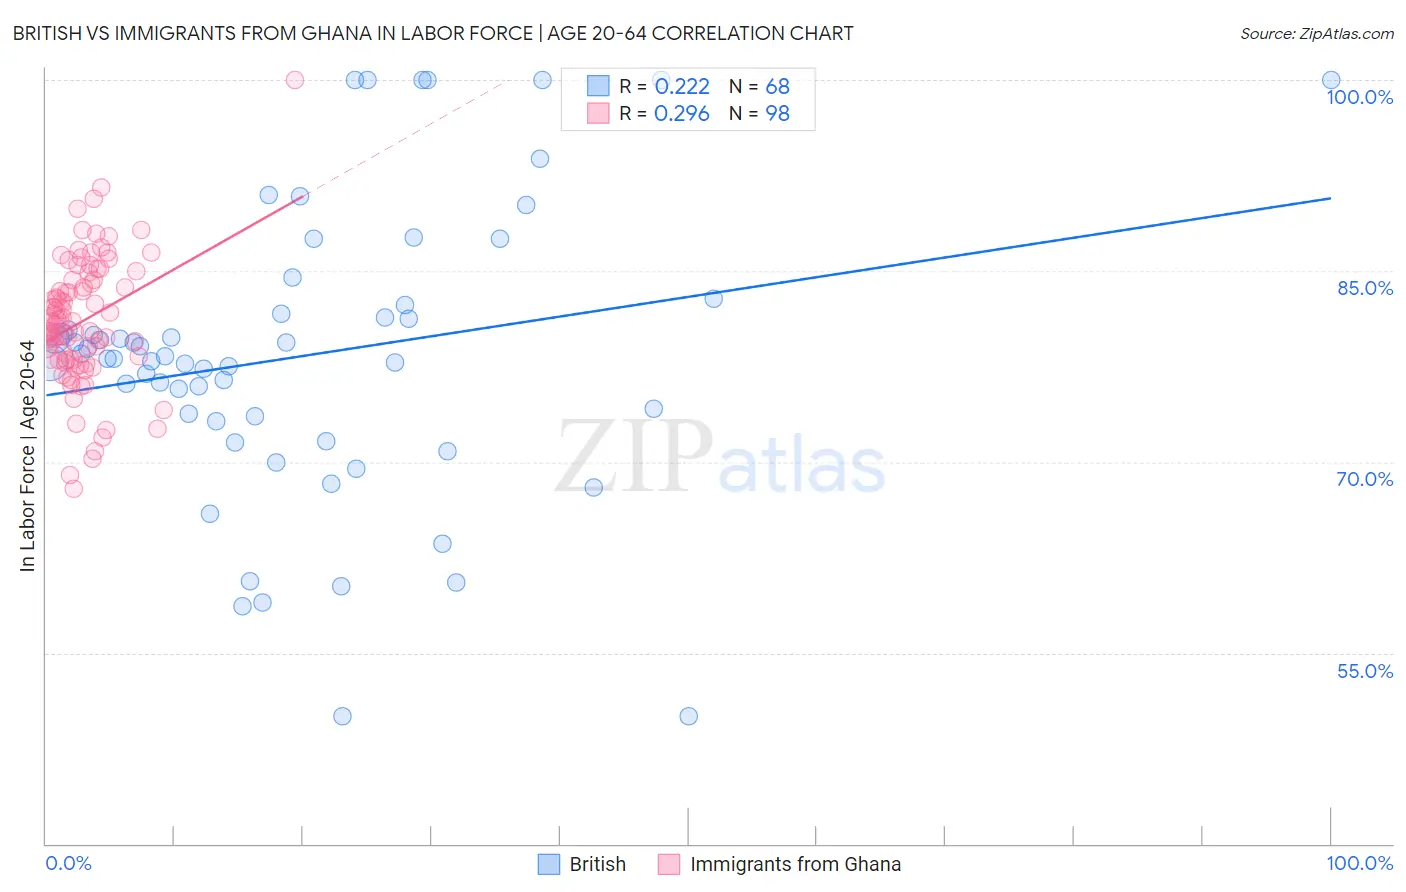
British vs Immigrants from Ghana In Labor Force | Age 20-64 Correlation Chart
The statistical analysis conducted on geographies consisting of 531,500,819 people shows a weak positive correlation between the proportion of British and labor force participation rate among population between the ages 20 and 64 in the United States with a correlation coefficient (R) of 0.222 and weighted average of 79.3%. Similarly, the statistical analysis conducted on geographies consisting of 199,964,545 people shows a weak positive correlation between the proportion of Immigrants from Ghana and labor force participation rate among population between the ages 20 and 64 in the United States with a correlation coefficient (R) of 0.296 and weighted average of 80.0%, a difference of 0.92%.
In Labor Force | Age 20-64 Correlation Summary
| Measurement | British | Immigrants from Ghana |
| Minimum | 50.0% | 67.9% |
| Maximum | 100.0% | 100.0% |
| Range | 50.0% | 32.1% |
| Mean | 78.3% | 81.1% |
| Median | 78.2% | 81.0% |
| Interquartile 25% (IQ1) | 73.4% | 78.0% |
| Interquartile 75% (IQ3) | 81.9% | 84.3% |
| Interquartile Range (IQR) | 8.6% | 6.3% |
| Standard Deviation (Sample) | 11.4% | 5.1% |
| Standard Deviation (Population) | 11.3% | 5.0% |
Similar Demographics by In Labor Force | Age 20-64
Demographics Similar to British by In Labor Force | Age 20-64
In terms of in labor force | age 20-64, the demographic groups most similar to British are Subsaharan African (79.3%, a difference of 0.0%), Bangladeshi (79.3%, a difference of 0.0%), Immigrants from Ecuador (79.3%, a difference of 0.010%), Haitian (79.3%, a difference of 0.010%), and Iraqi (79.3%, a difference of 0.020%).
| Demographics | Rating | Rank | In Labor Force | Age 20-64 |
| Immigrants | Nicaragua | 19.0 /100 | #201 | Poor 79.3% |
| Nicaraguans | 18.3 /100 | #202 | Poor 79.3% |
| Iraqis | 17.7 /100 | #203 | Poor 79.3% |
| Immigrants | Cambodia | 17.6 /100 | #204 | Poor 79.3% |
| Immigrants | Congo | 17.5 /100 | #205 | Poor 79.3% |
| Immigrants | Ecuador | 16.9 /100 | #206 | Poor 79.3% |
| Sub-Saharan Africans | 16.5 /100 | #207 | Poor 79.3% |
| British | 16.5 /100 | #208 | Poor 79.3% |
| Bangladeshis | 16.4 /100 | #209 | Poor 79.3% |
| Haitians | 16.1 /100 | #210 | Poor 79.3% |
| Europeans | 15.3 /100 | #211 | Poor 79.3% |
| Irish | 13.2 /100 | #212 | Poor 79.3% |
| Immigrants | Portugal | 12.8 /100 | #213 | Poor 79.3% |
| Immigrants | Armenia | 12.2 /100 | #214 | Poor 79.2% |
| Immigrants | Norway | 12.0 /100 | #215 | Poor 79.2% |
Demographics Similar to Immigrants from Ghana by In Labor Force | Age 20-64
In terms of in labor force | age 20-64, the demographic groups most similar to Immigrants from Ghana are Venezuelan (80.0%, a difference of 0.010%), Greek (80.0%, a difference of 0.010%), Immigrants from Jordan (80.0%, a difference of 0.010%), Palestinian (80.0%, a difference of 0.020%), and Immigrants from Australia (80.0%, a difference of 0.020%).
| Demographics | Rating | Rank | In Labor Force | Age 20-64 |
| Immigrants | Uruguay | 95.8 /100 | #98 | Exceptional 80.1% |
| Immigrants | Chile | 95.7 /100 | #99 | Exceptional 80.1% |
| Filipinos | 95.6 /100 | #100 | Exceptional 80.1% |
| Palestinians | 95.5 /100 | #101 | Exceptional 80.0% |
| Immigrants | Australia | 95.5 /100 | #102 | Exceptional 80.0% |
| Russians | 95.5 /100 | #103 | Exceptional 80.0% |
| Venezuelans | 95.3 /100 | #104 | Exceptional 80.0% |
| Immigrants | Ghana | 95.0 /100 | #105 | Exceptional 80.0% |
| Greeks | 94.8 /100 | #106 | Exceptional 80.0% |
| Immigrants | Jordan | 94.8 /100 | #107 | Exceptional 80.0% |
| Iranians | 94.3 /100 | #108 | Exceptional 80.0% |
| Immigrants | Argentina | 94.1 /100 | #109 | Exceptional 80.0% |
| Estonians | 94.0 /100 | #110 | Exceptional 80.0% |
| Immigrants | South America | 93.9 /100 | #111 | Exceptional 80.0% |
| Immigrants | Italy | 93.9 /100 | #112 | Exceptional 80.0% |