Eastern European vs Immigrants from Kenya In Labor Force | Age 35-44
COMPARE
Eastern European
Immigrants from Kenya
In Labor Force | Age 35-44
In Labor Force | Age 35-44 Comparison
Eastern Europeans
Immigrants from Kenya
85.2%
IN LABOR FORCE | AGE 35-44
99.8/ 100
METRIC RATING
39th/ 347
METRIC RANK
85.1%
IN LABOR FORCE | AGE 35-44
99.6/ 100
METRIC RATING
52nd/ 347
METRIC RANK
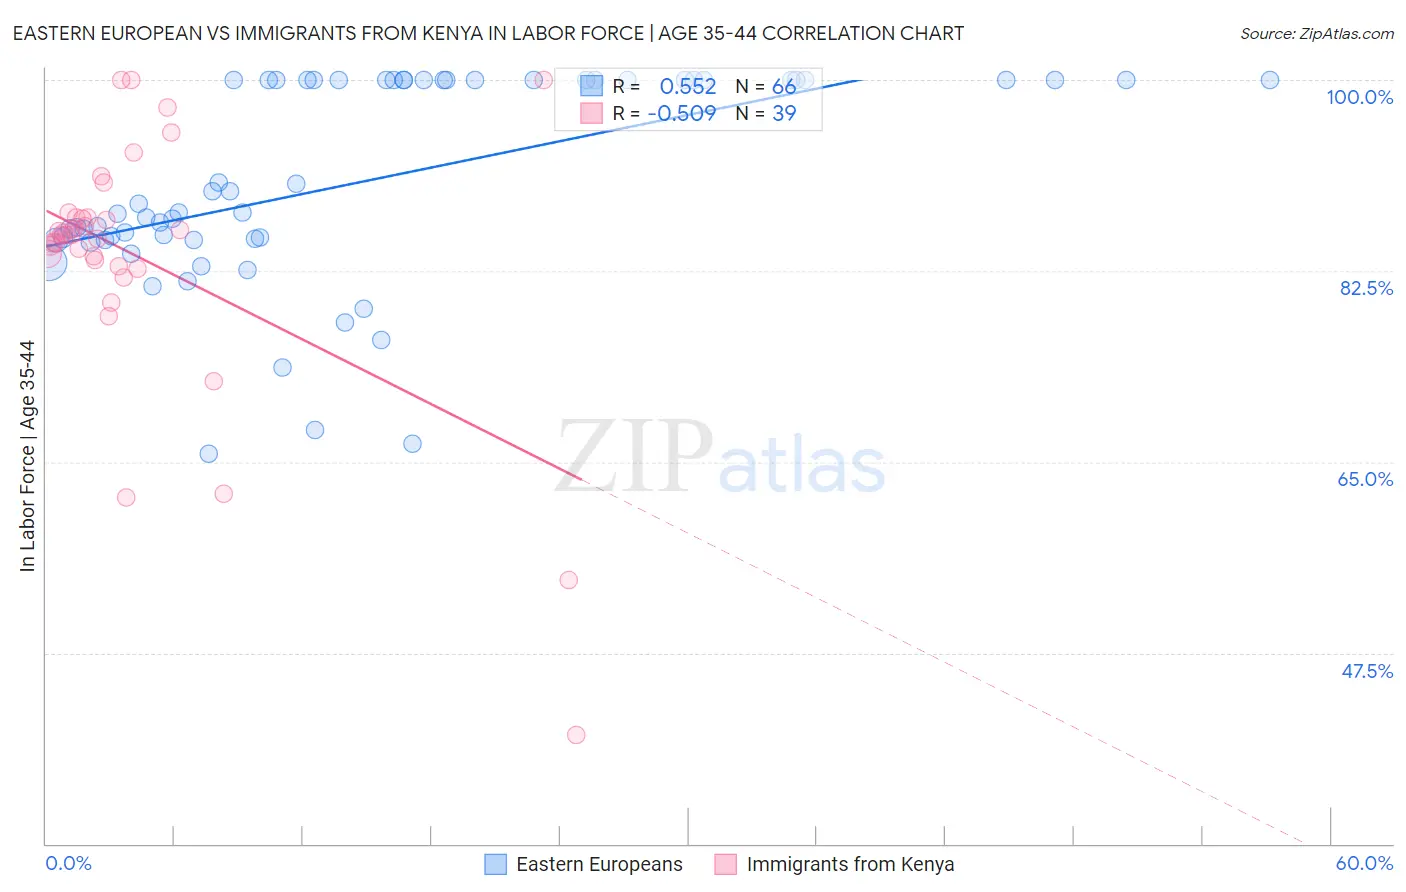
Eastern European vs Immigrants from Kenya In Labor Force | Age 35-44 Correlation Chart
The statistical analysis conducted on geographies consisting of 461,005,621 people shows a substantial positive correlation between the proportion of Eastern Europeans and labor force participation rate among population between the ages 35 and 44 in the United States with a correlation coefficient (R) of 0.552 and weighted average of 85.2%. Similarly, the statistical analysis conducted on geographies consisting of 218,019,455 people shows a substantial negative correlation between the proportion of Immigrants from Kenya and labor force participation rate among population between the ages 35 and 44 in the United States with a correlation coefficient (R) of -0.509 and weighted average of 85.1%, a difference of 0.13%.
In Labor Force | Age 35-44 Correlation Summary
| Measurement | Eastern European | Immigrants from Kenya |
| Minimum | 65.7% | 40.0% |
| Maximum | 100.0% | 100.0% |
| Range | 34.3% | 60.0% |
| Mean | 90.6% | 83.7% |
| Median | 88.3% | 85.8% |
| Interquartile 25% (IQ1) | 85.4% | 82.9% |
| Interquartile 75% (IQ3) | 100.0% | 87.5% |
| Interquartile Range (IQR) | 14.6% | 4.6% |
| Standard Deviation (Sample) | 9.4% | 11.9% |
| Standard Deviation (Population) | 9.3% | 11.7% |
Demographics Similar to Eastern Europeans and Immigrants from Kenya by In Labor Force | Age 35-44
In terms of in labor force | age 35-44, the demographic groups most similar to Eastern Europeans are Immigrants from Poland (85.2%, a difference of 0.0%), Kenyan (85.2%, a difference of 0.010%), Immigrants from Bulgaria (85.2%, a difference of 0.010%), Immigrants from Zimbabwe (85.2%, a difference of 0.010%), and Macedonian (85.2%, a difference of 0.010%). Similarly, the demographic groups most similar to Immigrants from Kenya are Taiwanese (85.1%, a difference of 0.010%), Immigrants from Albania (85.1%, a difference of 0.030%), Turkish (85.1%, a difference of 0.030%), Soviet Union (85.1%, a difference of 0.030%), and Thai (85.2%, a difference of 0.040%).
| Demographics | Rating | Rank | In Labor Force | Age 35-44 |
| Estonians | 99.9 /100 | #35 | Exceptional 85.3% |
| Immigrants | Morocco | 99.8 /100 | #36 | Exceptional 85.2% |
| Kenyans | 99.8 /100 | #37 | Exceptional 85.2% |
| Immigrants | Poland | 99.8 /100 | #38 | Exceptional 85.2% |
| Eastern Europeans | 99.8 /100 | #39 | Exceptional 85.2% |
| Immigrants | Bulgaria | 99.8 /100 | #40 | Exceptional 85.2% |
| Immigrants | Zimbabwe | 99.8 /100 | #41 | Exceptional 85.2% |
| Macedonians | 99.8 /100 | #42 | Exceptional 85.2% |
| Poles | 99.8 /100 | #43 | Exceptional 85.2% |
| Lithuanians | 99.8 /100 | #44 | Exceptional 85.2% |
| Cypriots | 99.8 /100 | #45 | Exceptional 85.2% |
| Immigrants | Hong Kong | 99.8 /100 | #46 | Exceptional 85.2% |
| German Russians | 99.8 /100 | #47 | Exceptional 85.2% |
| Immigrants | Eritrea | 99.7 /100 | #48 | Exceptional 85.2% |
| Croatians | 99.7 /100 | #49 | Exceptional 85.2% |
| Thais | 99.7 /100 | #50 | Exceptional 85.2% |
| Immigrants | Albania | 99.7 /100 | #51 | Exceptional 85.1% |
| Immigrants | Kenya | 99.6 /100 | #52 | Exceptional 85.1% |
| Taiwanese | 99.6 /100 | #53 | Exceptional 85.1% |
| Turks | 99.5 /100 | #54 | Exceptional 85.1% |
| Soviet Union | 99.5 /100 | #55 | Exceptional 85.1% |