Dutch vs Immigrants from Kenya In Labor Force | Age 35-44
COMPARE
Dutch
Immigrants from Kenya
In Labor Force | Age 35-44
In Labor Force | Age 35-44 Comparison
Dutch
Immigrants from Kenya
84.3%
IN LABOR FORCE | AGE 35-44
34.8/ 100
METRIC RATING
187th/ 347
METRIC RANK
85.1%
IN LABOR FORCE | AGE 35-44
99.6/ 100
METRIC RATING
52nd/ 347
METRIC RANK
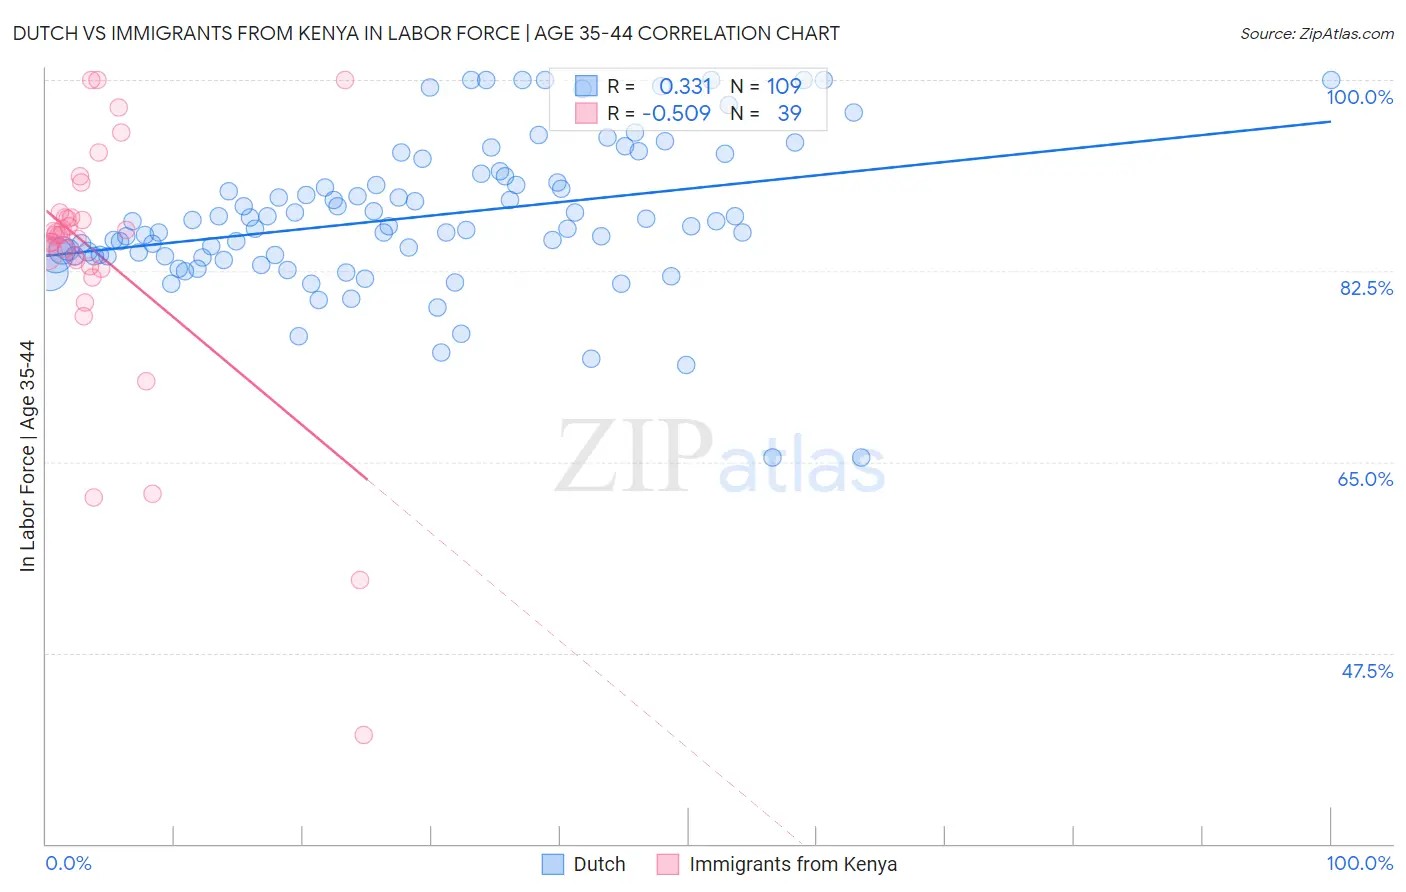
Dutch vs Immigrants from Kenya In Labor Force | Age 35-44 Correlation Chart
The statistical analysis conducted on geographies consisting of 553,838,892 people shows a mild positive correlation between the proportion of Dutch and labor force participation rate among population between the ages 35 and 44 in the United States with a correlation coefficient (R) of 0.331 and weighted average of 84.3%. Similarly, the statistical analysis conducted on geographies consisting of 218,019,455 people shows a substantial negative correlation between the proportion of Immigrants from Kenya and labor force participation rate among population between the ages 35 and 44 in the United States with a correlation coefficient (R) of -0.509 and weighted average of 85.1%, a difference of 1.0%.
In Labor Force | Age 35-44 Correlation Summary
| Measurement | Dutch | Immigrants from Kenya |
| Minimum | 65.4% | 40.0% |
| Maximum | 100.0% | 100.0% |
| Range | 34.6% | 60.0% |
| Mean | 87.4% | 83.7% |
| Median | 86.6% | 85.8% |
| Interquartile 25% (IQ1) | 83.8% | 82.9% |
| Interquartile 75% (IQ3) | 90.9% | 87.5% |
| Interquartile Range (IQR) | 7.0% | 4.6% |
| Standard Deviation (Sample) | 6.8% | 11.9% |
| Standard Deviation (Population) | 6.8% | 11.7% |
Similar Demographics by In Labor Force | Age 35-44
Demographics Similar to Dutch by In Labor Force | Age 35-44
In terms of in labor force | age 35-44, the demographic groups most similar to Dutch are Costa Rican (84.3%, a difference of 0.0%), Australian (84.3%, a difference of 0.0%), Immigrants from West Indies (84.3%, a difference of 0.010%), Korean (84.3%, a difference of 0.010%), and Barbadian (84.3%, a difference of 0.010%).
| Demographics | Rating | Rank | In Labor Force | Age 35-44 |
| Danes | 38.8 /100 | #180 | Fair 84.3% |
| Immigrants | West Indies | 36.4 /100 | #181 | Fair 84.3% |
| Koreans | 36.3 /100 | #182 | Fair 84.3% |
| Barbadians | 36.2 /100 | #183 | Fair 84.3% |
| Armenians | 35.6 /100 | #184 | Fair 84.3% |
| Costa Ricans | 35.3 /100 | #185 | Fair 84.3% |
| Australians | 35.1 /100 | #186 | Fair 84.3% |
| Dutch | 34.8 /100 | #187 | Fair 84.3% |
| South Africans | 34.1 /100 | #188 | Fair 84.3% |
| Immigrants | Denmark | 33.7 /100 | #189 | Fair 84.3% |
| Portuguese | 31.9 /100 | #190 | Fair 84.3% |
| Immigrants | Philippines | 27.9 /100 | #191 | Fair 84.2% |
| Immigrants | Vietnam | 27.4 /100 | #192 | Fair 84.2% |
| Hungarians | 26.8 /100 | #193 | Fair 84.2% |
| Immigrants | Indonesia | 25.7 /100 | #194 | Fair 84.2% |
Demographics Similar to Immigrants from Kenya by In Labor Force | Age 35-44
In terms of in labor force | age 35-44, the demographic groups most similar to Immigrants from Kenya are Taiwanese (85.1%, a difference of 0.010%), Immigrants from Albania (85.1%, a difference of 0.030%), Turkish (85.1%, a difference of 0.030%), Soviet Union (85.1%, a difference of 0.030%), and Thai (85.2%, a difference of 0.040%).
| Demographics | Rating | Rank | In Labor Force | Age 35-44 |
| Cypriots | 99.8 /100 | #45 | Exceptional 85.2% |
| Immigrants | Hong Kong | 99.8 /100 | #46 | Exceptional 85.2% |
| German Russians | 99.8 /100 | #47 | Exceptional 85.2% |
| Immigrants | Eritrea | 99.7 /100 | #48 | Exceptional 85.2% |
| Croatians | 99.7 /100 | #49 | Exceptional 85.2% |
| Thais | 99.7 /100 | #50 | Exceptional 85.2% |
| Immigrants | Albania | 99.7 /100 | #51 | Exceptional 85.1% |
| Immigrants | Kenya | 99.6 /100 | #52 | Exceptional 85.1% |
| Taiwanese | 99.6 /100 | #53 | Exceptional 85.1% |
| Turks | 99.5 /100 | #54 | Exceptional 85.1% |
| Soviet Union | 99.5 /100 | #55 | Exceptional 85.1% |
| Immigrants | Croatia | 99.5 /100 | #56 | Exceptional 85.1% |
| Chinese | 99.4 /100 | #57 | Exceptional 85.1% |
| Slovaks | 99.4 /100 | #58 | Exceptional 85.1% |
| Serbians | 99.4 /100 | #59 | Exceptional 85.1% |