English vs Immigrants from Southern Europe In Labor Force | Age 30-34
COMPARE
English
Immigrants from Southern Europe
In Labor Force | Age 30-34
In Labor Force | Age 30-34 Comparison
English
Immigrants from Southern Europe
84.0%
IN LABOR FORCE | AGE 30-34
1.4/ 100
METRIC RATING
239th/ 347
METRIC RANK
85.1%
IN LABOR FORCE | AGE 30-34
93.3/ 100
METRIC RATING
120th/ 347
METRIC RANK
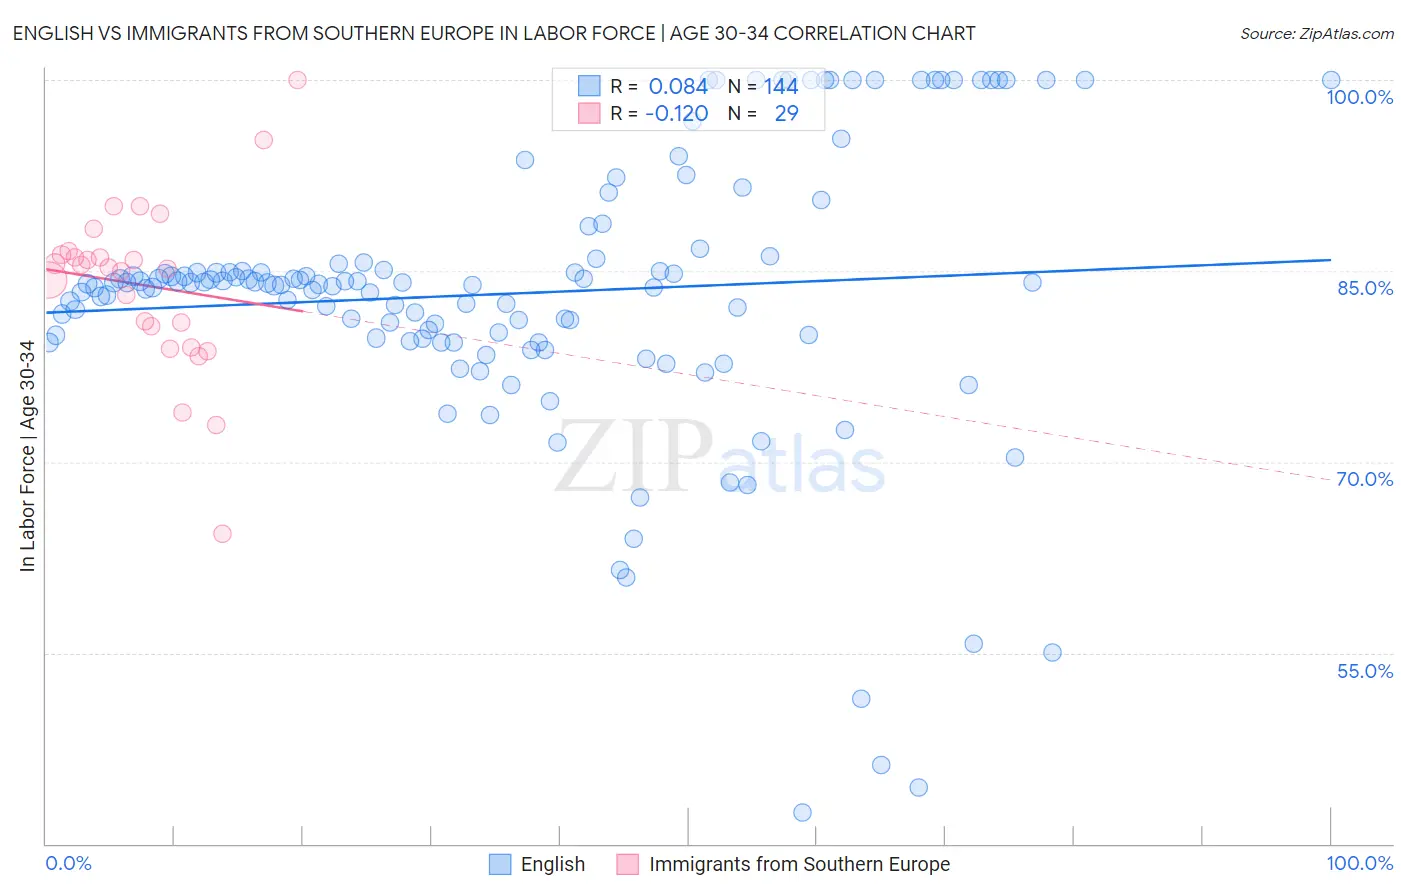
English vs Immigrants from Southern Europe In Labor Force | Age 30-34 Correlation Chart
The statistical analysis conducted on geographies consisting of 577,859,579 people shows a slight positive correlation between the proportion of English and labor force participation rate among population between the ages 30 and 34 in the United States with a correlation coefficient (R) of 0.084 and weighted average of 84.0%. Similarly, the statistical analysis conducted on geographies consisting of 402,565,184 people shows a poor negative correlation between the proportion of Immigrants from Southern Europe and labor force participation rate among population between the ages 30 and 34 in the United States with a correlation coefficient (R) of -0.120 and weighted average of 85.1%, a difference of 1.2%.
In Labor Force | Age 30-34 Correlation Summary
| Measurement | English | Immigrants from Southern Europe |
| Minimum | 42.5% | 64.4% |
| Maximum | 100.0% | 100.0% |
| Range | 57.5% | 35.6% |
| Mean | 83.2% | 83.9% |
| Median | 84.0% | 85.3% |
| Interquartile 25% (IQ1) | 79.7% | 79.8% |
| Interquartile 75% (IQ3) | 85.6% | 86.4% |
| Interquartile Range (IQR) | 5.9% | 6.6% |
| Standard Deviation (Sample) | 11.1% | 6.8% |
| Standard Deviation (Population) | 11.0% | 6.7% |
Similar Demographics by In Labor Force | Age 30-34
Demographics Similar to English by In Labor Force | Age 30-34
In terms of in labor force | age 30-34, the demographic groups most similar to English are Immigrants from Barbados (84.0%, a difference of 0.0%), Venezuelan (84.0%, a difference of 0.0%), Celtic (84.1%, a difference of 0.010%), U.S. Virgin Islander (84.1%, a difference of 0.020%), and Immigrants from Portugal (84.0%, a difference of 0.020%).
| Demographics | Rating | Rank | In Labor Force | Age 30-34 |
| Immigrants | Immigrants | 2.0 /100 | #232 | Tragic 84.1% |
| West Indians | 1.9 /100 | #233 | Tragic 84.1% |
| Haitians | 1.8 /100 | #234 | Tragic 84.1% |
| French American Indians | 1.7 /100 | #235 | Tragic 84.1% |
| U.S. Virgin Islanders | 1.5 /100 | #236 | Tragic 84.1% |
| Celtics | 1.4 /100 | #237 | Tragic 84.1% |
| Immigrants | Barbados | 1.4 /100 | #238 | Tragic 84.0% |
| English | 1.4 /100 | #239 | Tragic 84.0% |
| Venezuelans | 1.3 /100 | #240 | Tragic 84.0% |
| Immigrants | Portugal | 1.2 /100 | #241 | Tragic 84.0% |
| Immigrants | Oceania | 1.1 /100 | #242 | Tragic 84.0% |
| Immigrants | Caribbean | 1.1 /100 | #243 | Tragic 84.0% |
| Basques | 0.9 /100 | #244 | Tragic 84.0% |
| Immigrants | Venezuela | 0.9 /100 | #245 | Tragic 84.0% |
| Central Americans | 0.9 /100 | #246 | Tragic 84.0% |
Demographics Similar to Immigrants from Southern Europe by In Labor Force | Age 30-34
In terms of in labor force | age 30-34, the demographic groups most similar to Immigrants from Southern Europe are Asian (85.1%, a difference of 0.0%), Immigrants from Egypt (85.1%, a difference of 0.0%), Immigrants from Kuwait (85.1%, a difference of 0.020%), Immigrants from Denmark (85.1%, a difference of 0.030%), and Immigrants from Malaysia (85.1%, a difference of 0.030%).
| Demographics | Rating | Rank | In Labor Force | Age 30-34 |
| Immigrants | Romania | 94.7 /100 | #113 | Exceptional 85.1% |
| Yugoslavians | 94.7 /100 | #114 | Exceptional 85.1% |
| Immigrants | South Central Asia | 94.6 /100 | #115 | Exceptional 85.1% |
| Egyptians | 94.5 /100 | #116 | Exceptional 85.1% |
| Immigrants | Denmark | 94.3 /100 | #117 | Exceptional 85.1% |
| Immigrants | Malaysia | 94.2 /100 | #118 | Exceptional 85.1% |
| Asians | 93.4 /100 | #119 | Exceptional 85.1% |
| Immigrants | Southern Europe | 93.3 /100 | #120 | Exceptional 85.1% |
| Immigrants | Egypt | 93.2 /100 | #121 | Exceptional 85.1% |
| Immigrants | Kuwait | 92.6 /100 | #122 | Exceptional 85.1% |
| Armenians | 92.2 /100 | #123 | Exceptional 85.0% |
| Australians | 92.0 /100 | #124 | Exceptional 85.0% |
| Immigrants | Jordan | 91.5 /100 | #125 | Exceptional 85.0% |
| Austrians | 90.9 /100 | #126 | Exceptional 85.0% |
| Slavs | 90.7 /100 | #127 | Exceptional 85.0% |