Spaniard vs Immigrants from Southern Europe In Labor Force | Age 30-34
COMPARE
Spaniard
Immigrants from Southern Europe
In Labor Force | Age 30-34
In Labor Force | Age 30-34 Comparison
Spaniards
Immigrants from Southern Europe
83.6%
IN LABOR FORCE | AGE 30-34
0.1/ 100
METRIC RATING
267th/ 347
METRIC RANK
85.1%
IN LABOR FORCE | AGE 30-34
93.3/ 100
METRIC RATING
120th/ 347
METRIC RANK
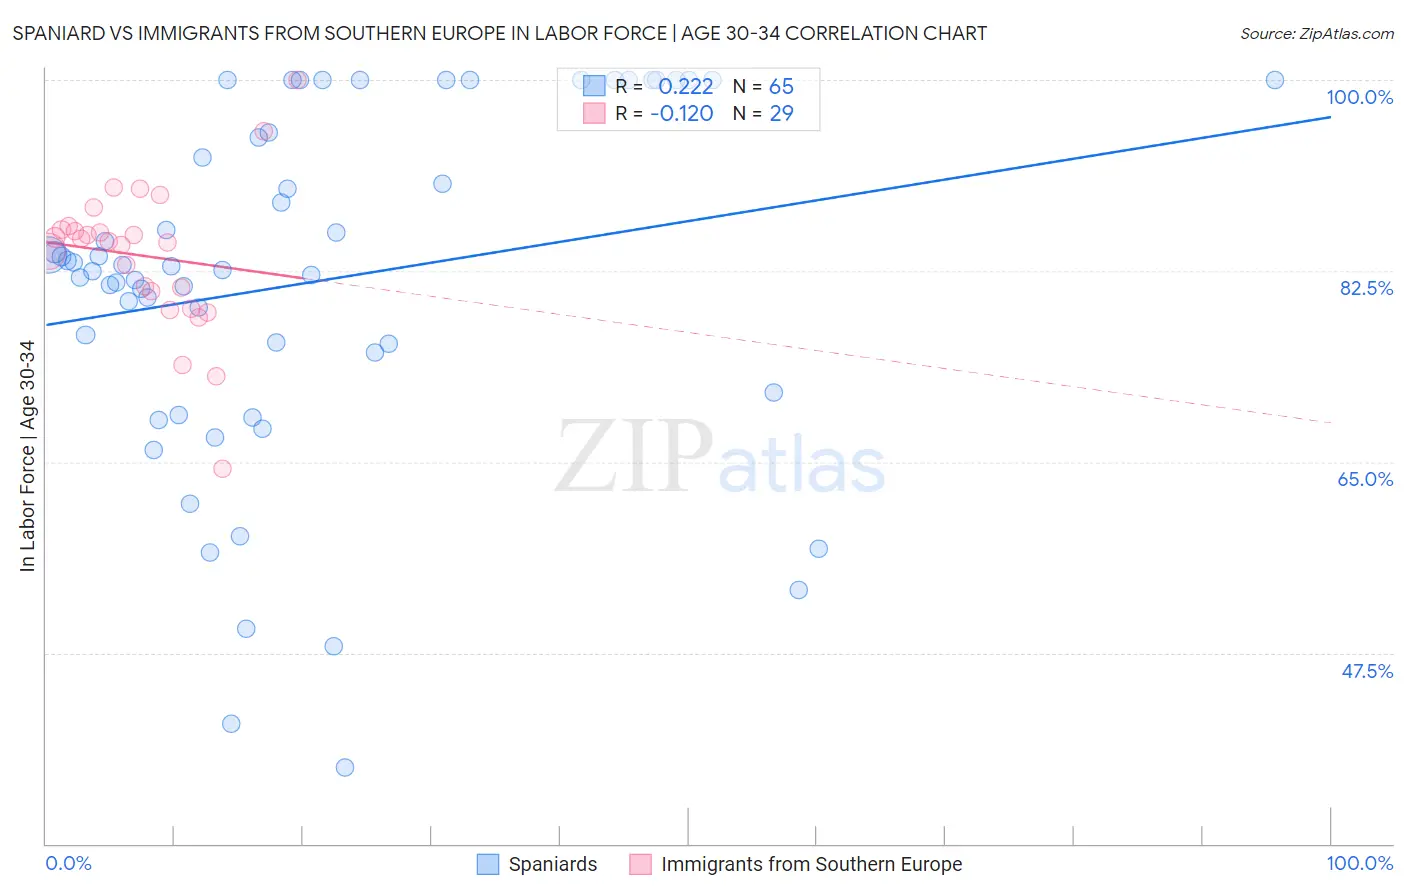
Spaniard vs Immigrants from Southern Europe In Labor Force | Age 30-34 Correlation Chart
The statistical analysis conducted on geographies consisting of 443,126,023 people shows a weak positive correlation between the proportion of Spaniards and labor force participation rate among population between the ages 30 and 34 in the United States with a correlation coefficient (R) of 0.222 and weighted average of 83.6%. Similarly, the statistical analysis conducted on geographies consisting of 402,565,184 people shows a poor negative correlation between the proportion of Immigrants from Southern Europe and labor force participation rate among population between the ages 30 and 34 in the United States with a correlation coefficient (R) of -0.120 and weighted average of 85.1%, a difference of 1.8%.
In Labor Force | Age 30-34 Correlation Summary
| Measurement | Spaniard | Immigrants from Southern Europe |
| Minimum | 36.9% | 64.4% |
| Maximum | 100.0% | 100.0% |
| Range | 63.1% | 35.6% |
| Mean | 81.5% | 83.9% |
| Median | 82.9% | 85.3% |
| Interquartile 25% (IQ1) | 73.2% | 79.8% |
| Interquartile 75% (IQ3) | 97.6% | 86.4% |
| Interquartile Range (IQR) | 24.4% | 6.6% |
| Standard Deviation (Sample) | 16.0% | 6.8% |
| Standard Deviation (Population) | 15.8% | 6.7% |
Similar Demographics by In Labor Force | Age 30-34
Demographics Similar to Spaniards by In Labor Force | Age 30-34
In terms of in labor force | age 30-34, the demographic groups most similar to Spaniards are Immigrants from Bangladesh (83.6%, a difference of 0.010%), Vietnamese (83.6%, a difference of 0.020%), Spanish American (83.5%, a difference of 0.070%), Spanish (83.5%, a difference of 0.090%), and Nonimmigrants (83.5%, a difference of 0.090%).
| Demographics | Rating | Rank | In Labor Force | Age 30-34 |
| Immigrants | Dominican Republic | 0.3 /100 | #260 | Tragic 83.8% |
| Guyanese | 0.3 /100 | #261 | Tragic 83.8% |
| Dominicans | 0.2 /100 | #262 | Tragic 83.8% |
| Immigrants | Guyana | 0.2 /100 | #263 | Tragic 83.8% |
| Guatemalans | 0.2 /100 | #264 | Tragic 83.7% |
| Immigrants | Honduras | 0.1 /100 | #265 | Tragic 83.7% |
| Immigrants | Guatemala | 0.1 /100 | #266 | Tragic 83.7% |
| Spaniards | 0.1 /100 | #267 | Tragic 83.6% |
| Immigrants | Bangladesh | 0.1 /100 | #268 | Tragic 83.6% |
| Vietnamese | 0.1 /100 | #269 | Tragic 83.6% |
| Spanish Americans | 0.0 /100 | #270 | Tragic 83.5% |
| Spanish | 0.0 /100 | #271 | Tragic 83.5% |
| Immigrants | Nonimmigrants | 0.0 /100 | #272 | Tragic 83.5% |
| Guamanians/Chamorros | 0.0 /100 | #273 | Tragic 83.5% |
| Belizeans | 0.0 /100 | #274 | Tragic 83.5% |
Demographics Similar to Immigrants from Southern Europe by In Labor Force | Age 30-34
In terms of in labor force | age 30-34, the demographic groups most similar to Immigrants from Southern Europe are Asian (85.1%, a difference of 0.0%), Immigrants from Egypt (85.1%, a difference of 0.0%), Immigrants from Kuwait (85.1%, a difference of 0.020%), Immigrants from Denmark (85.1%, a difference of 0.030%), and Immigrants from Malaysia (85.1%, a difference of 0.030%).
| Demographics | Rating | Rank | In Labor Force | Age 30-34 |
| Immigrants | Romania | 94.7 /100 | #113 | Exceptional 85.1% |
| Yugoslavians | 94.7 /100 | #114 | Exceptional 85.1% |
| Immigrants | South Central Asia | 94.6 /100 | #115 | Exceptional 85.1% |
| Egyptians | 94.5 /100 | #116 | Exceptional 85.1% |
| Immigrants | Denmark | 94.3 /100 | #117 | Exceptional 85.1% |
| Immigrants | Malaysia | 94.2 /100 | #118 | Exceptional 85.1% |
| Asians | 93.4 /100 | #119 | Exceptional 85.1% |
| Immigrants | Southern Europe | 93.3 /100 | #120 | Exceptional 85.1% |
| Immigrants | Egypt | 93.2 /100 | #121 | Exceptional 85.1% |
| Immigrants | Kuwait | 92.6 /100 | #122 | Exceptional 85.1% |
| Armenians | 92.2 /100 | #123 | Exceptional 85.0% |
| Australians | 92.0 /100 | #124 | Exceptional 85.0% |
| Immigrants | Jordan | 91.5 /100 | #125 | Exceptional 85.0% |
| Austrians | 90.9 /100 | #126 | Exceptional 85.0% |
| Slavs | 90.7 /100 | #127 | Exceptional 85.0% |