Bangladeshi vs Immigrants from Southern Europe In Labor Force | Age 30-34

COMPARE

Bangladeshi
Race
Ancestry
AfghanAfricanAlaska NativeAlaskan AthabascanAlbanianAleutAlsatianAmericanApacheArabArapahoArgentineanArmenianAssyrian/Chaldean/SyriacAustralianAustrianBahamianBangladeshiBarbadianBasqueBelgianBelizeanBermudanBhutaneseBlackfeetBolivianBrazilianBritishBritish West IndianBulgarianBurmeseCajunCambodianCanadianCape VerdeanCarpatho RusynCelticCentral AmericanCentral American IndianCherokeeCheyenneChickasawChileanChineseChippewaChoctawColombianColvilleComancheCosta RicanCreeCreekCroatianCrowCubanCypriotCzechCzechoslovakianDanishDelawareDominicanDutchDutch West IndianEastern EuropeanEcuadorianEgyptianEnglishEstonianEthiopianEuropeanFijianFilipinoFinnishFrenchFrench American IndianFrench CanadianGermanGerman RussianGhanaianGreekGuamanian/ChamorroGuatemalanGuyaneseHaitianHmongHonduranHopiHoumaHungarianIcelanderIndian (Asian)IndonesianInupiatIranianIraqiIrishIroquoisIsraeliItalianJamaicanJapaneseJordanianKenyanKiowaKoreanLaotianLatvianLebaneseLiberianLithuanianLumbeeLuxembourgerMacedonianMalaysianMalteseMarshalleseMenomineeMexicanMexican American IndianMongolianMoroccanNative HawaiianNavajoNepaleseNew ZealanderNicaraguanNigerianNorthern EuropeanNorwegianOkinawanOsageOttawaPaiutePakistaniPalestinianPanamanianParaguayanPennsylvania GermanPeruvianPimaPolishPortuguesePotawatomiPuebloPuerto RicanPuget Sound SalishRomanianRussianSalvadoranSamoanScandinavianScotch-IrishScottishSeminoleSenegaleseSerbianShoshoneSierra LeoneanSiouxSlavicSlovakSloveneSomaliSouth AfricanSouth AmericanSouth American IndianSoviet UnionSpaniardSpanishSpanish AmericanSpanish American IndianSri LankanSubsaharan AfricanSudaneseSwedishSwissSyrianTaiwaneseThaiTlingit-HaidaTohono O'OdhamTonganTrinidadian and TobagonianTsimshianTurkishU.S. Virgin IslanderUgandanUkrainianUruguayanUteVenezuelanVietnameseWelshWest IndianYakamaYaquiYugoslavianYumanYup'ikZimbabwean
Immigration
NonimmigrantsImmigrantsAfghanistanAfricaAlbaniaArgentinaArmeniaAsiaAustraliaAustriaBahamasBangladeshBarbadosBelarusBelgiumBelizeBoliviaBosnia and HerzegovinaBrazilBulgariaBurma/MyanmarCabo VerdeCambodiaCameroonCanadaCaribbeanCentral AmericaChileChinaColombiaCongoCosta RicaCroatiaCubaCzechoslovakiaDenmarkDominicaDominican RepublicEastern AfricaEastern AsiaEastern EuropeEcuadorEgyptEl SalvadorEnglandEritreaEthiopiaEuropeFijiFranceGermanyGhanaGreeceGrenadaGuatemalaGuyanaHaitiHondurasHong KongHungaryIndiaIndonesiaIranIraqIrelandIsraelItalyJamaicaJapanJordanKazakhstanKenyaKoreaKuwaitLaosLatin AmericaLatviaLebanonLiberiaLithuaniaMalaysiaMexicoMicronesiaMiddle AfricaMoldovaMoroccoNepalNetherlandsNicaraguaNigeriaNorth AmericaNorth MacedoniaNorthern AfricaNorthern EuropeNorwayOceaniaPakistanPanamaPeruPhilippinesPolandPortugalRomaniaRussiaSaudi ArabiaScotlandSenegalSerbiaSierra LeoneSingaporeSomaliaSouth AfricaSouth AmericaSouth Central AsiaSouth Eastern AsiaSpainSri LankaSt. Vincent and the GrenadinesSudanSwedenSwitzerlandSyriaTaiwanThailandTrinidad and TobagoTurkeyUgandaUkraineUruguayUzbekistanVenezuelaVietnamWest IndiesWestern AfricaWestern AsiaWestern EuropeYemenZaireZimbabweAzores
Immigrants from Southern Europe
Race
Ancestry
AfghanAfricanAlaska NativeAlaskan AthabascanAlbanianAleutAlsatianAmericanApacheArabArapahoArgentineanArmenianAssyrian/Chaldean/SyriacAustralianAustrianBahamianBarbadianBasqueBelgianBelizeanBermudanBhutaneseBlackfeetBolivianBrazilianBritishBritish West IndianBulgarianBurmeseCajunCambodianCanadianCape VerdeanCarpatho RusynCelticCentral AmericanCentral American IndianCherokeeCheyenneChickasawChileanChineseChippewaChoctawColombianColvilleComancheCosta RicanCreeCreekCroatianCrowCubanCypriotCzechCzechoslovakianDanishDelawareDominicanDutchDutch West IndianEastern EuropeanEcuadorianEgyptianEnglishEstonianEthiopianEuropeanFijianFilipinoFinnishFrenchFrench American IndianFrench CanadianGermanGerman RussianGhanaianGreekGuamanian/ChamorroGuatemalanGuyaneseHaitianHmongHonduranHopiHoumaHungarianIcelanderIndian (Asian)IndonesianInupiatIranianIraqiIrishIroquoisIsraeliItalianJamaicanJapaneseJordanianKenyanKiowaKoreanLaotianLatvianLebaneseLiberianLithuanianLumbeeLuxembourgerMacedonianMalaysianMalteseMarshalleseMenomineeMexicanMexican American IndianMongolianMoroccanNative HawaiianNavajoNepaleseNew ZealanderNicaraguanNigerianNorthern EuropeanNorwegianOkinawanOsageOttawaPaiutePakistaniPalestinianPanamanianParaguayanPennsylvania GermanPeruvianPimaPolishPortuguesePotawatomiPuebloPuerto RicanPuget Sound SalishRomanianRussianSalvadoranSamoanScandinavianScotch-IrishScottishSeminoleSenegaleseSerbianShoshoneSierra LeoneanSiouxSlavicSlovakSloveneSomaliSouth AfricanSouth AmericanSouth American IndianSoviet UnionSpaniardSpanishSpanish AmericanSpanish American IndianSri LankanSubsaharan AfricanSudaneseSwedishSwissSyrianTaiwaneseThaiTlingit-HaidaTohono O'OdhamTonganTrinidadian and TobagonianTsimshianTurkishU.S. Virgin IslanderUgandanUkrainianUruguayanUteVenezuelanVietnameseWelshWest IndianYakamaYaquiYugoslavianYumanYup'ikZimbabwean
Immigration
NonimmigrantsImmigrantsAfghanistanAfricaAlbaniaArgentinaArmeniaAsiaAustraliaAustriaBahamasBangladeshBarbadosBelarusBelgiumBelizeBoliviaBosnia and HerzegovinaBrazilBulgariaBurma/MyanmarCabo VerdeCambodiaCameroonCanadaCaribbeanCentral AmericaChileChinaColombiaCongoCosta RicaCroatiaCubaCzechoslovakiaDenmarkDominicaDominican RepublicEastern AfricaEastern AsiaEastern EuropeEcuadorEgyptEl SalvadorEnglandEritreaEthiopiaEuropeFijiFranceGermanyGhanaGreeceGrenadaGuatemalaGuyanaHaitiHondurasHong KongHungaryIndiaIndonesiaIranIraqIrelandIsraelItalyJamaicaJapanJordanKazakhstanKenyaKoreaKuwaitLaosLatin AmericaLatviaLebanonLiberiaLithuaniaMalaysiaMexicoMicronesiaMiddle AfricaMoldovaMoroccoNepalNetherlandsNicaraguaNigeriaNorth AmericaNorth MacedoniaNorthern AfricaNorthern EuropeNorwayOceaniaPakistanPanamaPeruPhilippinesPolandPortugalRomaniaRussiaSaudi ArabiaScotlandSenegalSerbiaSierra LeoneSingaporeSomaliaSouth AfricaSouth AmericaSouth Central AsiaSouth Eastern AsiaSouthern EuropeSpainSri LankaSt. Vincent and the GrenadinesSudanSwedenSwitzerlandSyriaTaiwanThailandTrinidad and TobagoTurkeyUgandaUkraineUruguayUzbekistanVenezuelaVietnamWest IndiesWestern AfricaWestern AsiaWestern EuropeYemenZaireZimbabweAzores
In Labor Force | Age 30-34
Income
Poverty
Unemployment
Labor Participation
Family Structure
Vehicle Availability
Education Level
Disability

In Labor Force | Age 30-34 Comparison

Bangladeshis

Immigrants from Southern Europe

Tragic
Exceptional
84.3%
IN LABOR FORCE | AGE 30-34
9.4/ 100
METRIC RATING
207th/ 347
METRIC RANK
85.1%
IN LABOR FORCE | AGE 30-34
93.3/ 100
METRIC RATING
120th/ 347
METRIC RANK

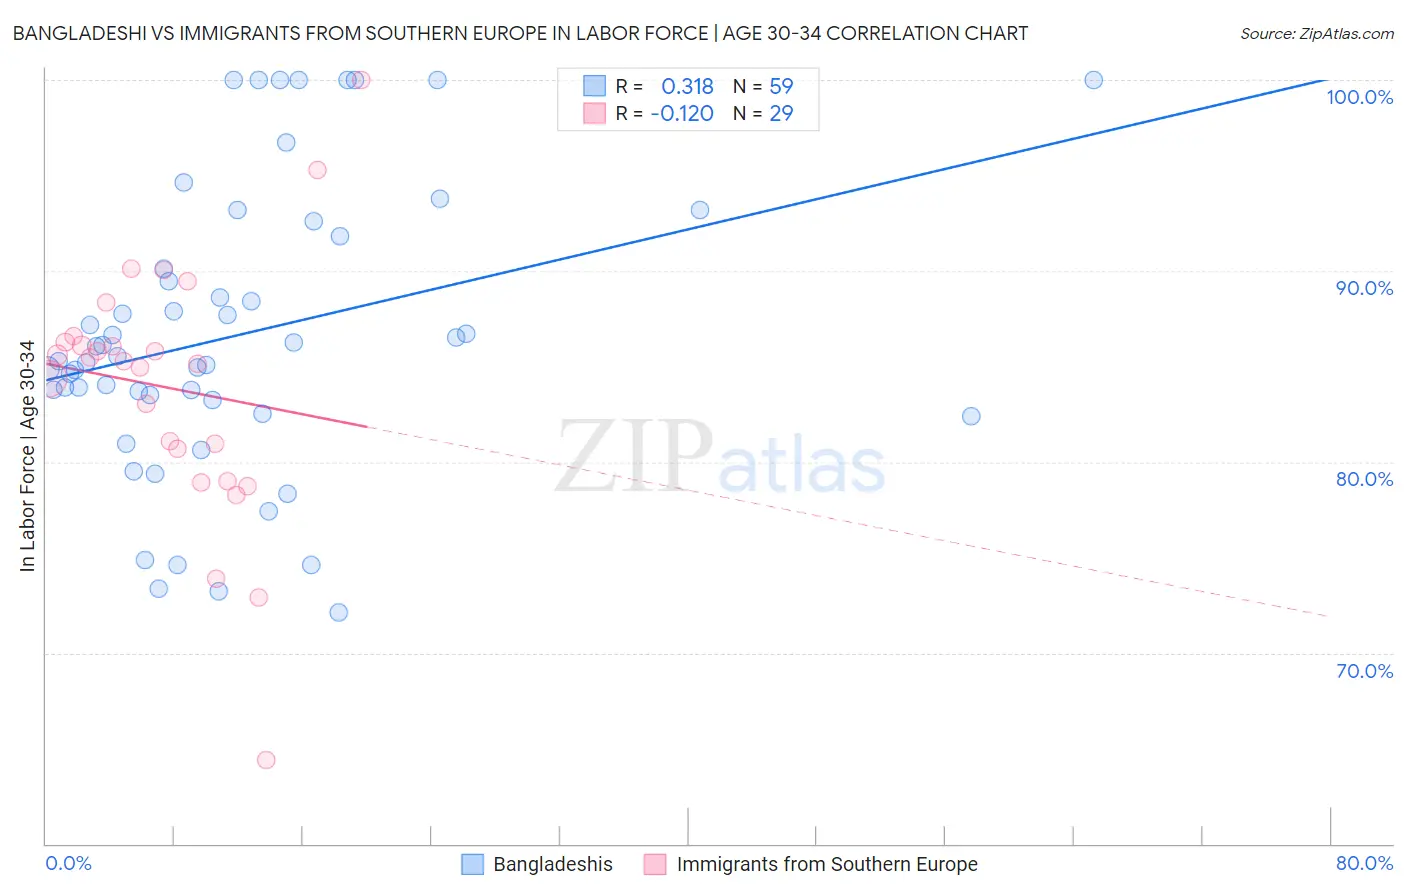
Bangladeshi vs Immigrants from Southern Europe In Labor Force | Age 30-34 Correlation Chart

The statistical analysis conducted on geographies consisting of 141,415,377 people shows a mild positive correlation between the proportion of Bangladeshis and labor force participation rate among population between the ages 30 and 34 in the United States with a correlation coefficient (R) of 0.318 and weighted average of 84.3%. Similarly, the statistical analysis conducted on geographies consisting of 402,565,184 people shows a poor negative correlation between the proportion of Immigrants from Southern Europe and labor force participation rate among population between the ages 30 and 34 in the United States with a correlation coefficient (R) of -0.120 and weighted average of 85.1%, a difference of 0.87%.
Bangladeshi vs Immigrants from Southern Europe In Labor Force | Age 30-34

In Labor Force | Age 30-34 Correlation Summary

MeasurementBangladeshiImmigrants from Southern Europe
Minimum72.1%64.4%
Maximum100.0%100.0%
Range27.9%35.6%
Mean86.7%83.9%
Median85.5%85.3%
Interquartile 25% (IQ1)83.2%79.8%
Interquartile 75% (IQ3)91.8%86.4%
Interquartile Range (IQR)8.6%6.6%
Standard Deviation (Sample)7.5%6.8%
Standard Deviation (Population)7.4%6.7%

Similar Demographics by In Labor Force | Age 30-34

Demographics Similar to Bangladeshis by In Labor Force | Age 30-34

In terms of in labor force | age 30-34, the demographic groups most similar to Bangladeshis are Arab (84.3%, a difference of 0.010%), Jamaican (84.3%, a difference of 0.010%), Indonesian (84.3%, a difference of 0.010%), Japanese (84.3%, a difference of 0.010%), and Lebanese (84.4%, a difference of 0.020%).
DemographicsRating | RankIn Labor Force | Age 30-34
Sub-Saharan Africans
19.0
/100
|
#200
Poor
84.5%
Trinidadians and Tobagonians
18.2
/100
|
#201
Poor
84.5%
Immigrants | West Indies
18.1
/100
|
#202
Poor
84.5%
Canadians
15.4
/100
|
#203
Poor
84.4%
Ecuadorians
14.2
/100
|
#204
Poor
84.4%
French
13.8
/100
|
#205
Poor
84.4%
Lebanese
10.6
/100
|
#206
Poor
84.4%
Bangladeshis
9.4
/100
|
#207
Tragic
84.3%
Arabs
8.9
/100
|
#208
Tragic
84.3%
Jamaicans
8.8
/100
|
#209
Tragic
84.3%
Indonesians
8.8
/100
|
#210
Tragic
84.3%
Japanese
8.8
/100
|
#211
Tragic
84.3%
Immigrants | Western Asia
8.2
/100
|
#212
Tragic
84.3%
Immigrants | Jamaica
7.9
/100
|
#213
Tragic
84.3%
Immigrants | Germany
7.2
/100
|
#214
Tragic
84.3%

Demographics Similar to Immigrants from Southern Europe by In Labor Force | Age 30-34

In terms of in labor force | age 30-34, the demographic groups most similar to Immigrants from Southern Europe are Asian (85.1%, a difference of 0.0%), Immigrants from Egypt (85.1%, a difference of 0.0%), Immigrants from Kuwait (85.1%, a difference of 0.020%), Immigrants from Denmark (85.1%, a difference of 0.030%), and Immigrants from Malaysia (85.1%, a difference of 0.030%).
DemographicsRating | RankIn Labor Force | Age 30-34
Immigrants | Romania
94.7
/100
|
#113
Exceptional
85.1%
Yugoslavians
94.7
/100
|
#114
Exceptional
85.1%
Immigrants | South Central Asia
94.6
/100
|
#115
Exceptional
85.1%
Egyptians
94.5
/100
|
#116
Exceptional
85.1%
Immigrants | Denmark
94.3
/100
|
#117
Exceptional
85.1%
Immigrants | Malaysia
94.2
/100
|
#118
Exceptional
85.1%
Asians
93.4
/100
|
#119
Exceptional
85.1%
Immigrants | Southern Europe
93.3
/100
|
#120
Exceptional
85.1%
Immigrants | Egypt
93.2
/100
|
#121
Exceptional
85.1%
Immigrants | Kuwait
92.6
/100
|
#122
Exceptional
85.1%
Armenians
92.2
/100
|
#123
Exceptional
85.0%
Australians
92.0
/100
|
#124
Exceptional
85.0%
Immigrants | Jordan
91.5
/100
|
#125
Exceptional
85.0%
Austrians
90.9
/100
|
#126
Exceptional
85.0%
Slavs
90.7
/100
|
#127
Exceptional
85.0%