Bhutanese vs Lithuanian In Labor Force | Age 45-54
COMPARE
Bhutanese
Lithuanian
In Labor Force | Age 45-54
In Labor Force | Age 45-54 Comparison
Bhutanese
Lithuanians
83.5%
IN LABOR FORCE | AGE 45-54
98.3/ 100
METRIC RATING
59th/ 347
METRIC RANK
83.6%
IN LABOR FORCE | AGE 45-54
99.1/ 100
METRIC RATING
46th/ 347
METRIC RANK
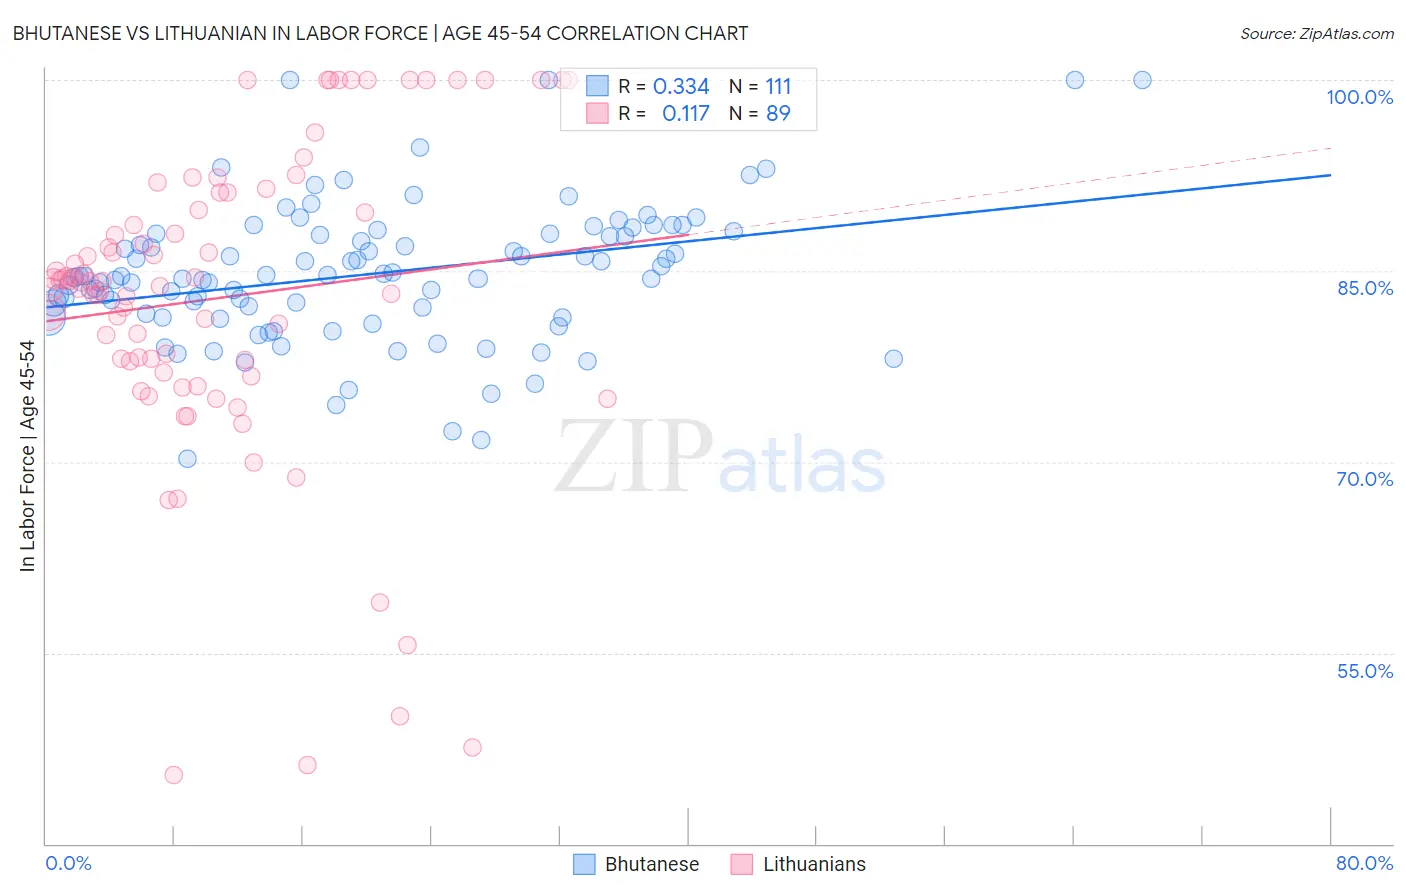
Bhutanese vs Lithuanian In Labor Force | Age 45-54 Correlation Chart
The statistical analysis conducted on geographies consisting of 455,122,141 people shows a mild positive correlation between the proportion of Bhutanese and labor force participation rate among population between the ages 45 and 54 in the United States with a correlation coefficient (R) of 0.334 and weighted average of 83.5%. Similarly, the statistical analysis conducted on geographies consisting of 421,730,198 people shows a poor positive correlation between the proportion of Lithuanians and labor force participation rate among population between the ages 45 and 54 in the United States with a correlation coefficient (R) of 0.117 and weighted average of 83.6%, a difference of 0.12%.
In Labor Force | Age 45-54 Correlation Summary
| Measurement | Bhutanese | Lithuanian |
| Minimum | 70.2% | 45.4% |
| Maximum | 100.0% | 100.0% |
| Range | 29.8% | 54.6% |
| Mean | 84.8% | 82.9% |
| Median | 84.6% | 84.2% |
| Interquartile 25% (IQ1) | 81.3% | 77.5% |
| Interquartile 75% (IQ3) | 87.9% | 90.5% |
| Interquartile Range (IQR) | 6.6% | 13.0% |
| Standard Deviation (Sample) | 5.5% | 12.2% |
| Standard Deviation (Population) | 5.4% | 12.2% |
Demographics Similar to Bhutanese and Lithuanians by In Labor Force | Age 45-54
In terms of in labor force | age 45-54, the demographic groups most similar to Bhutanese are Carpatho Rusyn (83.5%, a difference of 0.0%), Filipino (83.5%, a difference of 0.010%), Eastern European (83.5%, a difference of 0.020%), Immigrants from Peru (83.5%, a difference of 0.030%), and Paraguayan (83.5%, a difference of 0.030%). Similarly, the demographic groups most similar to Lithuanians are Burmese (83.6%, a difference of 0.010%), Immigrants from Hong Kong (83.6%, a difference of 0.010%), Croatian (83.6%, a difference of 0.010%), Immigrants from Poland (83.6%, a difference of 0.020%), and Immigrants from Morocco (83.6%, a difference of 0.020%).
| Demographics | Rating | Rank | In Labor Force | Age 45-54 |
| Immigrants | Moldova | 99.3 /100 | #42 | Exceptional 83.7% |
| Venezuelans | 99.2 /100 | #43 | Exceptional 83.6% |
| Burmese | 99.1 /100 | #44 | Exceptional 83.6% |
| Immigrants | Hong Kong | 99.1 /100 | #45 | Exceptional 83.6% |
| Lithuanians | 99.1 /100 | #46 | Exceptional 83.6% |
| Croatians | 99.0 /100 | #47 | Exceptional 83.6% |
| Immigrants | Poland | 99.0 /100 | #48 | Exceptional 83.6% |
| Immigrants | Morocco | 99.0 /100 | #49 | Exceptional 83.6% |
| Immigrants | Greece | 98.8 /100 | #50 | Exceptional 83.6% |
| Immigrants | Turkey | 98.8 /100 | #51 | Exceptional 83.6% |
| Poles | 98.7 /100 | #52 | Exceptional 83.6% |
| Peruvians | 98.7 /100 | #53 | Exceptional 83.6% |
| Somalis | 98.7 /100 | #54 | Exceptional 83.5% |
| Macedonians | 98.7 /100 | #55 | Exceptional 83.5% |
| Immigrants | Peru | 98.6 /100 | #56 | Exceptional 83.5% |
| Paraguayans | 98.5 /100 | #57 | Exceptional 83.5% |
| Eastern Europeans | 98.5 /100 | #58 | Exceptional 83.5% |
| Bhutanese | 98.3 /100 | #59 | Exceptional 83.5% |
| Carpatho Rusyns | 98.3 /100 | #60 | Exceptional 83.5% |
| Filipinos | 98.3 /100 | #61 | Exceptional 83.5% |
| Immigrants | Taiwan | 98.0 /100 | #62 | Exceptional 83.5% |