Spanish American vs Lithuanian In Labor Force | Age 45-54
COMPARE
Spanish American
Lithuanian
In Labor Force | Age 45-54
In Labor Force | Age 45-54 Comparison
Spanish Americans
Lithuanians
80.1%
IN LABOR FORCE | AGE 45-54
0.0/ 100
METRIC RATING
306th/ 347
METRIC RANK
83.6%
IN LABOR FORCE | AGE 45-54
99.1/ 100
METRIC RATING
46th/ 347
METRIC RANK
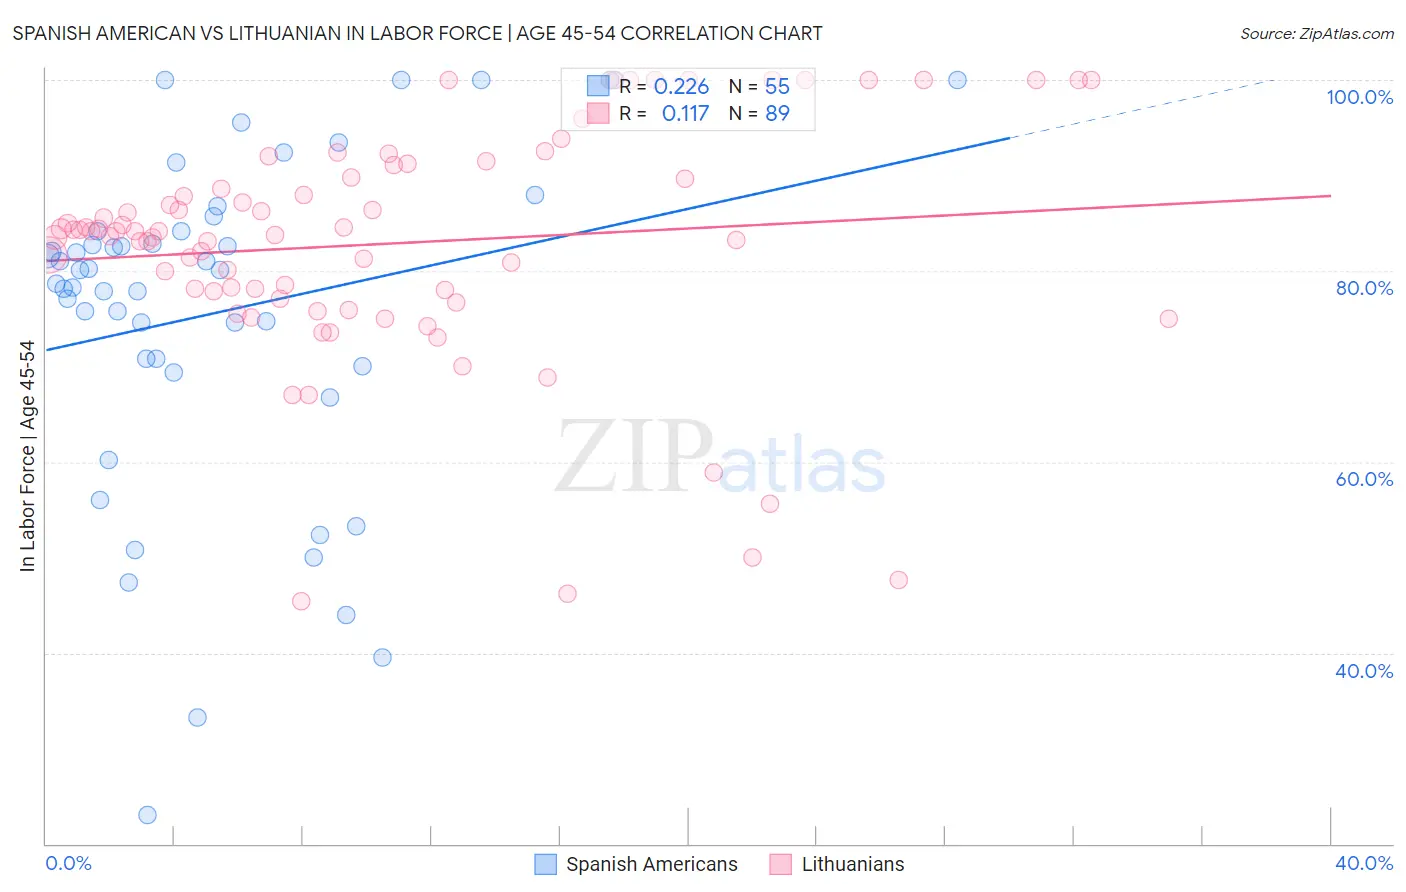
Spanish American vs Lithuanian In Labor Force | Age 45-54 Correlation Chart
The statistical analysis conducted on geographies consisting of 103,159,967 people shows a weak positive correlation between the proportion of Spanish Americans and labor force participation rate among population between the ages 45 and 54 in the United States with a correlation coefficient (R) of 0.226 and weighted average of 80.1%. Similarly, the statistical analysis conducted on geographies consisting of 421,730,198 people shows a poor positive correlation between the proportion of Lithuanians and labor force participation rate among population between the ages 45 and 54 in the United States with a correlation coefficient (R) of 0.117 and weighted average of 83.6%, a difference of 4.4%.
In Labor Force | Age 45-54 Correlation Summary
| Measurement | Spanish American | Lithuanian |
| Minimum | 23.0% | 45.4% |
| Maximum | 100.0% | 100.0% |
| Range | 77.0% | 54.6% |
| Mean | 75.7% | 82.9% |
| Median | 80.1% | 84.2% |
| Interquartile 25% (IQ1) | 70.0% | 77.5% |
| Interquartile 75% (IQ3) | 84.1% | 90.5% |
| Interquartile Range (IQR) | 14.1% | 13.0% |
| Standard Deviation (Sample) | 17.6% | 12.2% |
| Standard Deviation (Population) | 17.4% | 12.2% |
Similar Demographics by In Labor Force | Age 45-54
Demographics Similar to Spanish Americans by In Labor Force | Age 45-54
In terms of in labor force | age 45-54, the demographic groups most similar to Spanish Americans are Immigrants from Dominican Republic (80.1%, a difference of 0.040%), Hispanic or Latino (80.1%, a difference of 0.050%), Immigrants from the Azores (80.1%, a difference of 0.070%), Blackfeet (80.0%, a difference of 0.080%), and Central American Indian (80.0%, a difference of 0.12%).
| Demographics | Rating | Rank | In Labor Force | Age 45-54 |
| Dominicans | 0.0 /100 | #299 | Tragic 80.3% |
| Fijians | 0.0 /100 | #300 | Tragic 80.2% |
| Spanish American Indians | 0.0 /100 | #301 | Tragic 80.2% |
| Immigrants | Central America | 0.0 /100 | #302 | Tragic 80.2% |
| Immigrants | Azores | 0.0 /100 | #303 | Tragic 80.1% |
| Hispanics or Latinos | 0.0 /100 | #304 | Tragic 80.1% |
| Immigrants | Dominican Republic | 0.0 /100 | #305 | Tragic 80.1% |
| Spanish Americans | 0.0 /100 | #306 | Tragic 80.1% |
| Blackfeet | 0.0 /100 | #307 | Tragic 80.0% |
| Central American Indians | 0.0 /100 | #308 | Tragic 80.0% |
| Potawatomi | 0.0 /100 | #309 | Tragic 80.0% |
| Inupiat | 0.0 /100 | #310 | Tragic 79.9% |
| Mexicans | 0.0 /100 | #311 | Tragic 79.8% |
| Immigrants | Mexico | 0.0 /100 | #312 | Tragic 79.7% |
| Colville | 0.0 /100 | #313 | Tragic 79.5% |
Demographics Similar to Lithuanians by In Labor Force | Age 45-54
In terms of in labor force | age 45-54, the demographic groups most similar to Lithuanians are Burmese (83.6%, a difference of 0.010%), Immigrants from Hong Kong (83.6%, a difference of 0.010%), Croatian (83.6%, a difference of 0.010%), Immigrants from Poland (83.6%, a difference of 0.020%), and Immigrants from Morocco (83.6%, a difference of 0.020%).
| Demographics | Rating | Rank | In Labor Force | Age 45-54 |
| Immigrants | Cuba | 99.4 /100 | #39 | Exceptional 83.7% |
| Immigrants | Uganda | 99.4 /100 | #40 | Exceptional 83.7% |
| Immigrants | Korea | 99.3 /100 | #41 | Exceptional 83.7% |
| Immigrants | Moldova | 99.3 /100 | #42 | Exceptional 83.7% |
| Venezuelans | 99.2 /100 | #43 | Exceptional 83.6% |
| Burmese | 99.1 /100 | #44 | Exceptional 83.6% |
| Immigrants | Hong Kong | 99.1 /100 | #45 | Exceptional 83.6% |
| Lithuanians | 99.1 /100 | #46 | Exceptional 83.6% |
| Croatians | 99.0 /100 | #47 | Exceptional 83.6% |
| Immigrants | Poland | 99.0 /100 | #48 | Exceptional 83.6% |
| Immigrants | Morocco | 99.0 /100 | #49 | Exceptional 83.6% |
| Immigrants | Greece | 98.8 /100 | #50 | Exceptional 83.6% |
| Immigrants | Turkey | 98.8 /100 | #51 | Exceptional 83.6% |
| Poles | 98.7 /100 | #52 | Exceptional 83.6% |
| Peruvians | 98.7 /100 | #53 | Exceptional 83.6% |