Bhutanese vs African In Labor Force | Age 45-54
COMPARE
Bhutanese
African
In Labor Force | Age 45-54
In Labor Force | Age 45-54 Comparison
Bhutanese
Africans
83.5%
IN LABOR FORCE | AGE 45-54
98.3/ 100
METRIC RATING
59th/ 347
METRIC RANK
80.5%
IN LABOR FORCE | AGE 45-54
0.0/ 100
METRIC RATING
296th/ 347
METRIC RANK
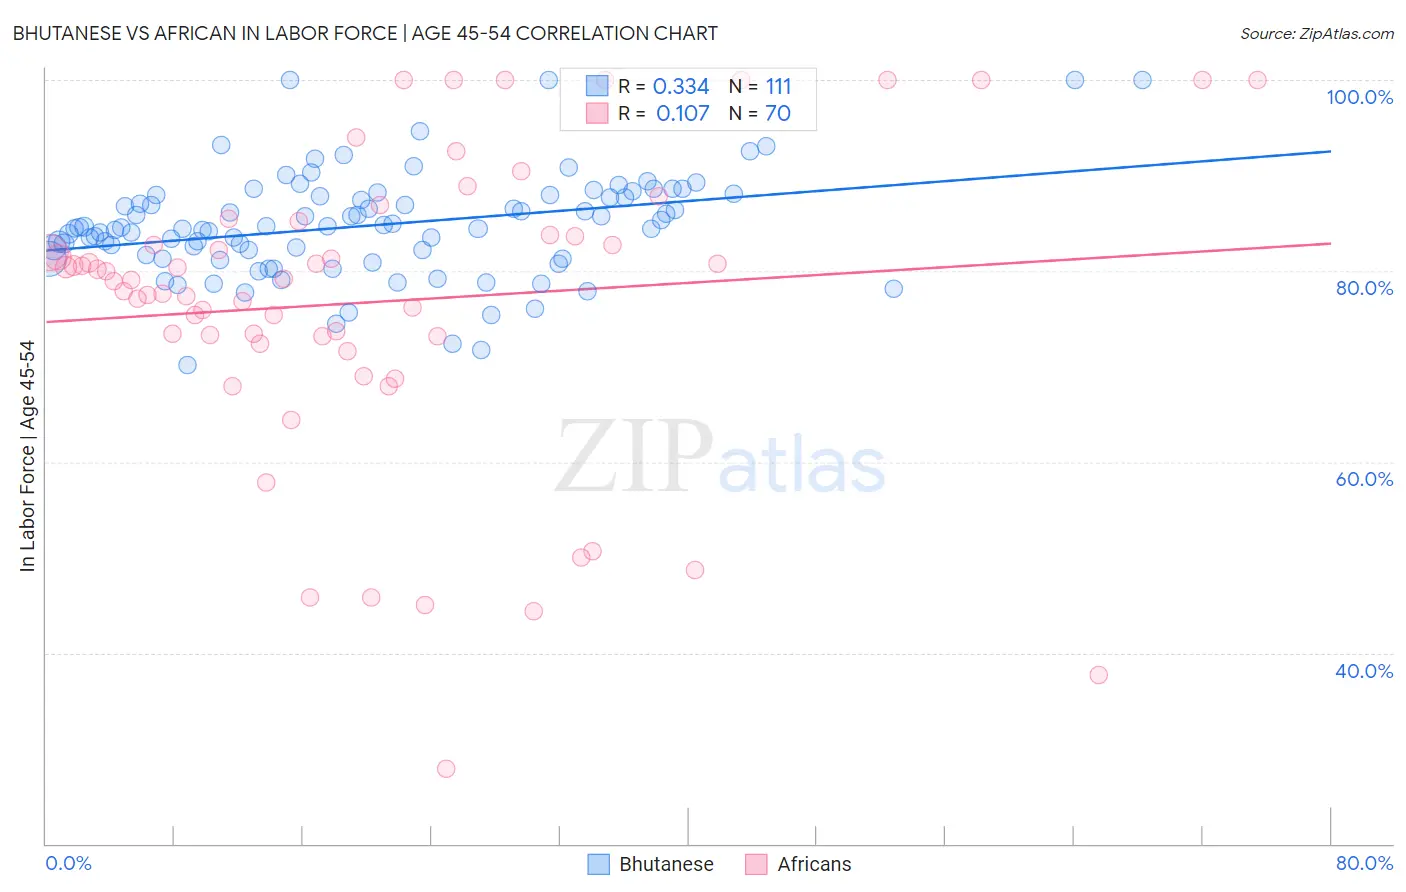
Bhutanese vs African In Labor Force | Age 45-54 Correlation Chart
The statistical analysis conducted on geographies consisting of 455,122,141 people shows a mild positive correlation between the proportion of Bhutanese and labor force participation rate among population between the ages 45 and 54 in the United States with a correlation coefficient (R) of 0.334 and weighted average of 83.5%. Similarly, the statistical analysis conducted on geographies consisting of 469,587,122 people shows a poor positive correlation between the proportion of Africans and labor force participation rate among population between the ages 45 and 54 in the United States with a correlation coefficient (R) of 0.107 and weighted average of 80.5%, a difference of 3.7%.
In Labor Force | Age 45-54 Correlation Summary
| Measurement | Bhutanese | African |
| Minimum | 70.2% | 27.9% |
| Maximum | 100.0% | 100.0% |
| Range | 29.8% | 72.1% |
| Mean | 84.8% | 76.8% |
| Median | 84.6% | 79.1% |
| Interquartile 25% (IQ1) | 81.3% | 73.2% |
| Interquartile 75% (IQ3) | 87.9% | 83.8% |
| Interquartile Range (IQR) | 6.6% | 10.6% |
| Standard Deviation (Sample) | 5.5% | 15.9% |
| Standard Deviation (Population) | 5.4% | 15.8% |
Similar Demographics by In Labor Force | Age 45-54
Demographics Similar to Bhutanese by In Labor Force | Age 45-54
In terms of in labor force | age 45-54, the demographic groups most similar to Bhutanese are Carpatho Rusyn (83.5%, a difference of 0.0%), Filipino (83.5%, a difference of 0.010%), Eastern European (83.5%, a difference of 0.020%), Immigrants from Peru (83.5%, a difference of 0.030%), and Paraguayan (83.5%, a difference of 0.030%).
| Demographics | Rating | Rank | In Labor Force | Age 45-54 |
| Poles | 98.7 /100 | #52 | Exceptional 83.6% |
| Peruvians | 98.7 /100 | #53 | Exceptional 83.6% |
| Somalis | 98.7 /100 | #54 | Exceptional 83.5% |
| Macedonians | 98.7 /100 | #55 | Exceptional 83.5% |
| Immigrants | Peru | 98.6 /100 | #56 | Exceptional 83.5% |
| Paraguayans | 98.5 /100 | #57 | Exceptional 83.5% |
| Eastern Europeans | 98.5 /100 | #58 | Exceptional 83.5% |
| Bhutanese | 98.3 /100 | #59 | Exceptional 83.5% |
| Carpatho Rusyns | 98.3 /100 | #60 | Exceptional 83.5% |
| Filipinos | 98.3 /100 | #61 | Exceptional 83.5% |
| Immigrants | Taiwan | 98.0 /100 | #62 | Exceptional 83.5% |
| Afghans | 97.9 /100 | #63 | Exceptional 83.5% |
| Immigrants | Kenya | 97.9 /100 | #64 | Exceptional 83.5% |
| Egyptians | 97.9 /100 | #65 | Exceptional 83.5% |
| Asians | 97.7 /100 | #66 | Exceptional 83.4% |
Demographics Similar to Africans by In Labor Force | Age 45-54
In terms of in labor force | age 45-54, the demographic groups most similar to Africans are Nepalese (80.5%, a difference of 0.040%), Osage (80.6%, a difference of 0.10%), Yakama (80.6%, a difference of 0.10%), Iroquois (80.6%, a difference of 0.12%), and Immigrants from Belize (80.6%, a difference of 0.15%).
| Demographics | Rating | Rank | In Labor Force | Age 45-54 |
| Immigrants | Bangladesh | 0.0 /100 | #289 | Tragic 80.7% |
| Mexican American Indians | 0.0 /100 | #290 | Tragic 80.7% |
| Immigrants | Belize | 0.0 /100 | #291 | Tragic 80.6% |
| Iroquois | 0.0 /100 | #292 | Tragic 80.6% |
| Osage | 0.0 /100 | #293 | Tragic 80.6% |
| Yakama | 0.0 /100 | #294 | Tragic 80.6% |
| Nepalese | 0.0 /100 | #295 | Tragic 80.5% |
| Africans | 0.0 /100 | #296 | Tragic 80.5% |
| Americans | 0.0 /100 | #297 | Tragic 80.4% |
| Marshallese | 0.0 /100 | #298 | Tragic 80.3% |
| Dominicans | 0.0 /100 | #299 | Tragic 80.3% |
| Fijians | 0.0 /100 | #300 | Tragic 80.2% |
| Spanish American Indians | 0.0 /100 | #301 | Tragic 80.2% |
| Immigrants | Central America | 0.0 /100 | #302 | Tragic 80.2% |
| Immigrants | Azores | 0.0 /100 | #303 | Tragic 80.1% |