Bhutanese vs Immigrants from Northern Africa In Labor Force | Age 45-54
COMPARE
Bhutanese
Immigrants from Northern Africa
In Labor Force | Age 45-54
In Labor Force | Age 45-54 Comparison
Bhutanese
Immigrants from Northern Africa
83.5%
IN LABOR FORCE | AGE 45-54
98.3/ 100
METRIC RATING
59th/ 347
METRIC RANK
83.3%
IN LABOR FORCE | AGE 45-54
95.7/ 100
METRIC RATING
86th/ 347
METRIC RANK
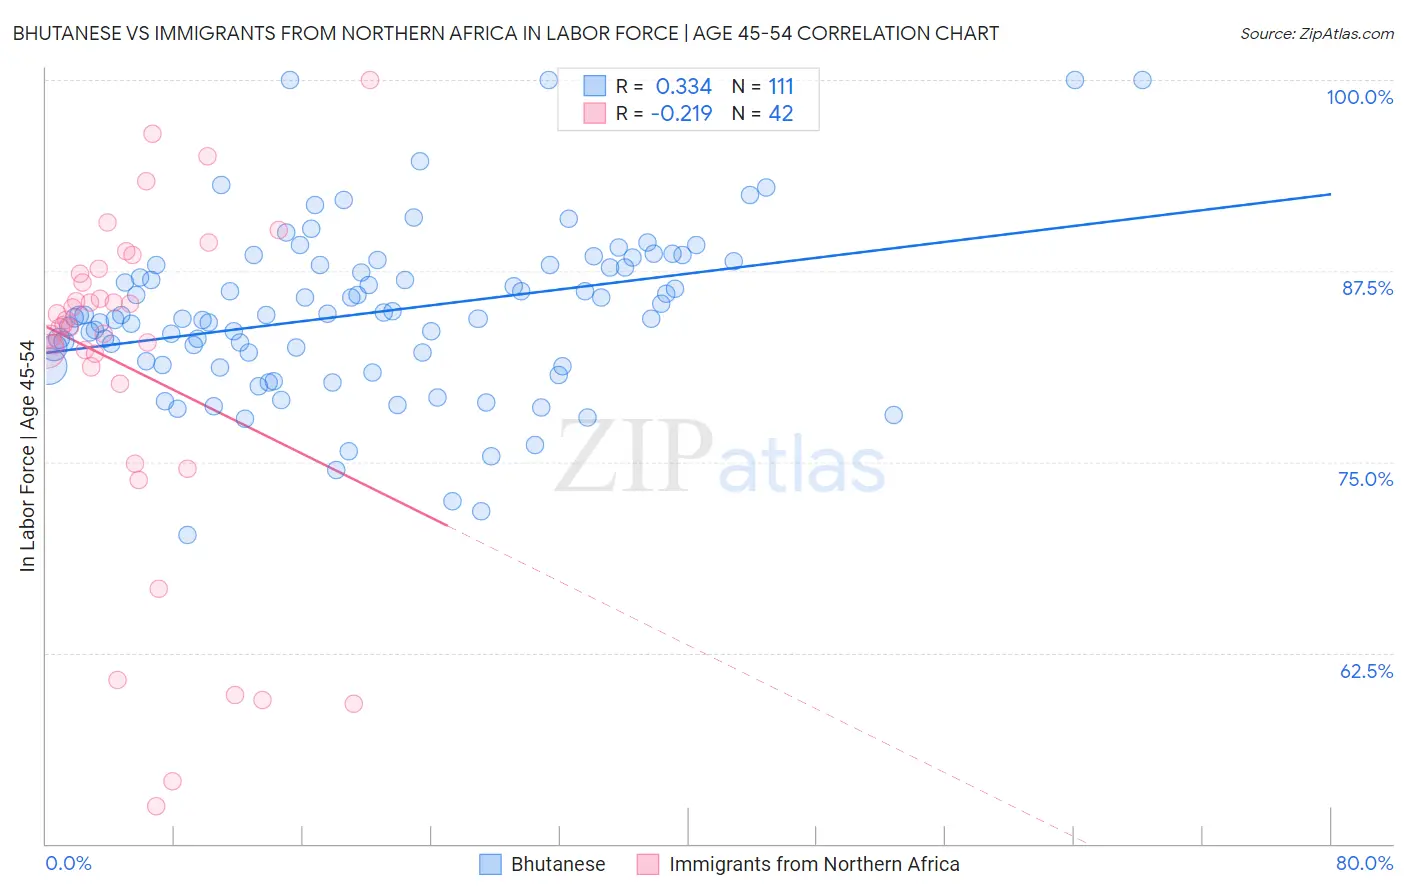
Bhutanese vs Immigrants from Northern Africa In Labor Force | Age 45-54 Correlation Chart
The statistical analysis conducted on geographies consisting of 455,122,141 people shows a mild positive correlation between the proportion of Bhutanese and labor force participation rate among population between the ages 45 and 54 in the United States with a correlation coefficient (R) of 0.334 and weighted average of 83.5%. Similarly, the statistical analysis conducted on geographies consisting of 321,062,040 people shows a weak negative correlation between the proportion of Immigrants from Northern Africa and labor force participation rate among population between the ages 45 and 54 in the United States with a correlation coefficient (R) of -0.219 and weighted average of 83.3%, a difference of 0.22%.
In Labor Force | Age 45-54 Correlation Summary
| Measurement | Bhutanese | Immigrants from Northern Africa |
| Minimum | 70.2% | 52.4% |
| Maximum | 100.0% | 100.0% |
| Range | 29.8% | 47.6% |
| Mean | 84.8% | 81.0% |
| Median | 84.6% | 83.9% |
| Interquartile 25% (IQ1) | 81.3% | 80.1% |
| Interquartile 75% (IQ3) | 87.9% | 87.3% |
| Interquartile Range (IQR) | 6.6% | 7.2% |
| Standard Deviation (Sample) | 5.5% | 11.4% |
| Standard Deviation (Population) | 5.4% | 11.2% |
Similar Demographics by In Labor Force | Age 45-54
Demographics Similar to Bhutanese by In Labor Force | Age 45-54
In terms of in labor force | age 45-54, the demographic groups most similar to Bhutanese are Carpatho Rusyn (83.5%, a difference of 0.0%), Filipino (83.5%, a difference of 0.010%), Eastern European (83.5%, a difference of 0.020%), Immigrants from Peru (83.5%, a difference of 0.030%), and Paraguayan (83.5%, a difference of 0.030%).
| Demographics | Rating | Rank | In Labor Force | Age 45-54 |
| Poles | 98.7 /100 | #52 | Exceptional 83.6% |
| Peruvians | 98.7 /100 | #53 | Exceptional 83.6% |
| Somalis | 98.7 /100 | #54 | Exceptional 83.5% |
| Macedonians | 98.7 /100 | #55 | Exceptional 83.5% |
| Immigrants | Peru | 98.6 /100 | #56 | Exceptional 83.5% |
| Paraguayans | 98.5 /100 | #57 | Exceptional 83.5% |
| Eastern Europeans | 98.5 /100 | #58 | Exceptional 83.5% |
| Bhutanese | 98.3 /100 | #59 | Exceptional 83.5% |
| Carpatho Rusyns | 98.3 /100 | #60 | Exceptional 83.5% |
| Filipinos | 98.3 /100 | #61 | Exceptional 83.5% |
| Immigrants | Taiwan | 98.0 /100 | #62 | Exceptional 83.5% |
| Afghans | 97.9 /100 | #63 | Exceptional 83.5% |
| Immigrants | Kenya | 97.9 /100 | #64 | Exceptional 83.5% |
| Egyptians | 97.9 /100 | #65 | Exceptional 83.5% |
| Asians | 97.7 /100 | #66 | Exceptional 83.4% |
Demographics Similar to Immigrants from Northern Africa by In Labor Force | Age 45-54
In terms of in labor force | age 45-54, the demographic groups most similar to Immigrants from Northern Africa are Immigrants from Eastern Europe (83.3%, a difference of 0.0%), Greek (83.3%, a difference of 0.010%), Immigrants from Asia (83.3%, a difference of 0.010%), Indian (Asian) (83.3%, a difference of 0.010%), and Immigrants from Japan (83.3%, a difference of 0.010%).
| Demographics | Rating | Rank | In Labor Force | Age 45-54 |
| Belgians | 96.5 /100 | #79 | Exceptional 83.4% |
| Immigrants | Croatia | 96.5 /100 | #80 | Exceptional 83.4% |
| Jordanians | 96.4 /100 | #81 | Exceptional 83.4% |
| Immigrants | Eastern Asia | 96.3 /100 | #82 | Exceptional 83.4% |
| Immigrants | Zimbabwe | 96.3 /100 | #83 | Exceptional 83.4% |
| Immigrants | Bosnia and Herzegovina | 96.0 /100 | #84 | Exceptional 83.3% |
| Greeks | 95.9 /100 | #85 | Exceptional 83.3% |
| Immigrants | Northern Africa | 95.7 /100 | #86 | Exceptional 83.3% |
| Immigrants | Eastern Europe | 95.6 /100 | #87 | Exceptional 83.3% |
| Immigrants | Asia | 95.6 /100 | #88 | Exceptional 83.3% |
| Indians (Asian) | 95.5 /100 | #89 | Exceptional 83.3% |
| Immigrants | Japan | 95.5 /100 | #90 | Exceptional 83.3% |
| South Americans | 95.5 /100 | #91 | Exceptional 83.3% |
| Danes | 95.3 /100 | #92 | Exceptional 83.3% |
| Italians | 95.1 /100 | #93 | Exceptional 83.3% |