Nonimmigrants vs Lithuanian In Labor Force | Age 45-54
COMPARE
Nonimmigrants
Lithuanian
In Labor Force | Age 45-54
In Labor Force | Age 45-54 Comparison
Nonimmigrants
Lithuanians
81.2%
IN LABOR FORCE | AGE 45-54
0.0/ 100
METRIC RATING
275th/ 347
METRIC RANK
83.6%
IN LABOR FORCE | AGE 45-54
99.1/ 100
METRIC RATING
46th/ 347
METRIC RANK
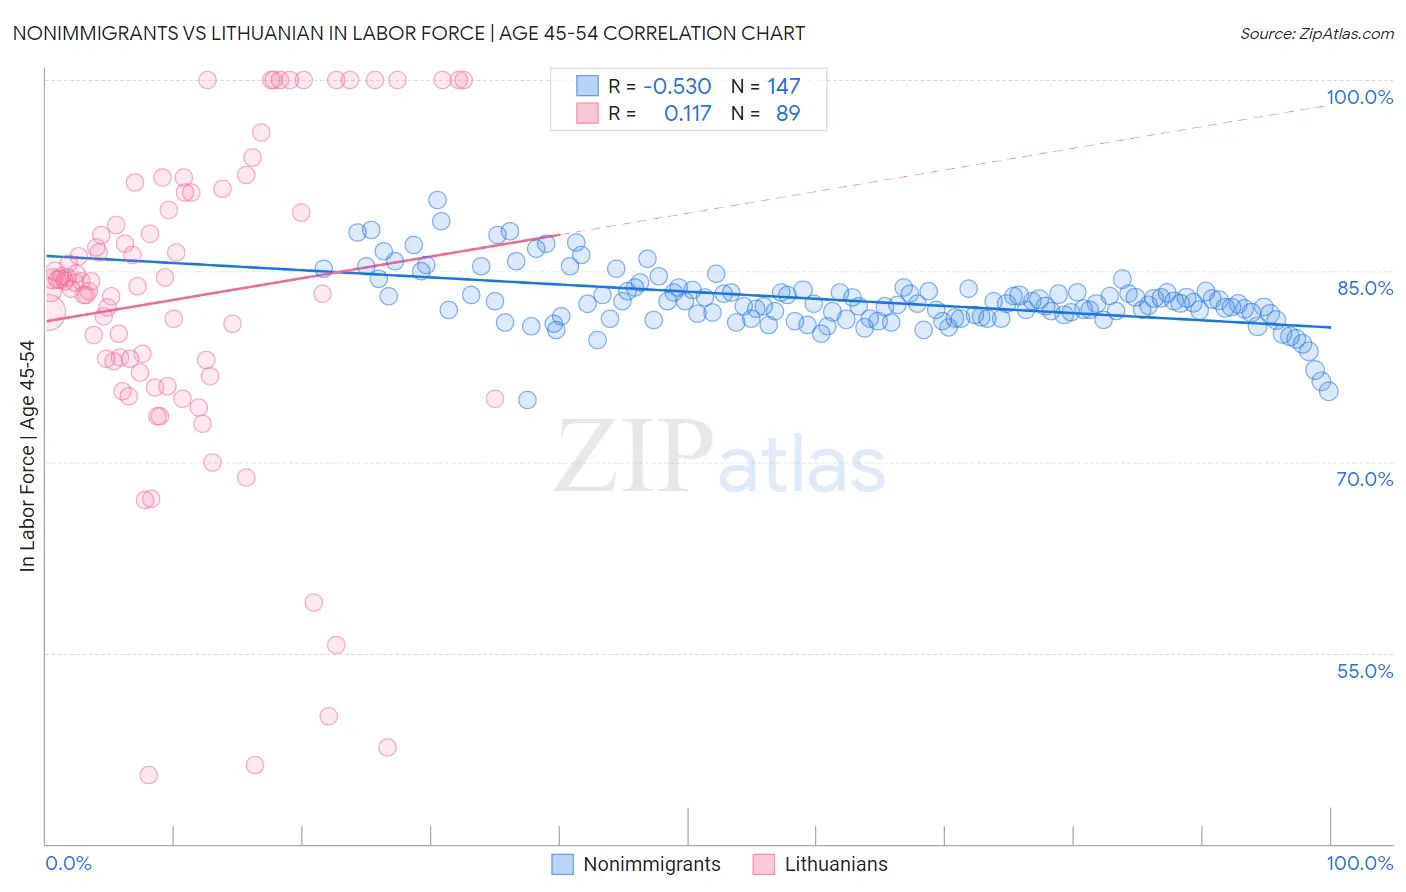
Nonimmigrants vs Lithuanian In Labor Force | Age 45-54 Correlation Chart
The statistical analysis conducted on geographies consisting of 584,054,768 people shows a substantial negative correlation between the proportion of Nonimmigrants and labor force participation rate among population between the ages 45 and 54 in the United States with a correlation coefficient (R) of -0.530 and weighted average of 81.2%. Similarly, the statistical analysis conducted on geographies consisting of 421,730,198 people shows a poor positive correlation between the proportion of Lithuanians and labor force participation rate among population between the ages 45 and 54 in the United States with a correlation coefficient (R) of 0.117 and weighted average of 83.6%, a difference of 2.9%.
In Labor Force | Age 45-54 Correlation Summary
| Measurement | Nonimmigrants | Lithuanian |
| Minimum | 74.9% | 45.4% |
| Maximum | 90.6% | 100.0% |
| Range | 15.7% | 54.6% |
| Mean | 82.6% | 82.9% |
| Median | 82.4% | 84.2% |
| Interquartile 25% (IQ1) | 81.3% | 77.5% |
| Interquartile 75% (IQ3) | 83.3% | 90.5% |
| Interquartile Range (IQR) | 2.1% | 13.0% |
| Standard Deviation (Sample) | 2.3% | 12.2% |
| Standard Deviation (Population) | 2.3% | 12.2% |
Similar Demographics by In Labor Force | Age 45-54
Demographics Similar to Nonimmigrants by In Labor Force | Age 45-54
In terms of in labor force | age 45-54, the demographic groups most similar to Nonimmigrants are British West Indian (81.2%, a difference of 0.010%), Chippewa (81.3%, a difference of 0.040%), U.S. Virgin Islander (81.2%, a difference of 0.040%), Guatemalan (81.2%, a difference of 0.060%), and Spanish (81.3%, a difference of 0.10%).
| Demographics | Rating | Rank | In Labor Force | Age 45-54 |
| Immigrants | Honduras | 0.0 /100 | #268 | Tragic 81.4% |
| Alsatians | 0.0 /100 | #269 | Tragic 81.3% |
| Bangladeshis | 0.0 /100 | #270 | Tragic 81.3% |
| Immigrants | Barbados | 0.0 /100 | #271 | Tragic 81.3% |
| Spanish | 0.0 /100 | #272 | Tragic 81.3% |
| Chippewa | 0.0 /100 | #273 | Tragic 81.3% |
| British West Indians | 0.0 /100 | #274 | Tragic 81.2% |
| Immigrants | Nonimmigrants | 0.0 /100 | #275 | Tragic 81.2% |
| U.S. Virgin Islanders | 0.0 /100 | #276 | Tragic 81.2% |
| Guatemalans | 0.0 /100 | #277 | Tragic 81.2% |
| Immigrants | Guatemala | 0.0 /100 | #278 | Tragic 81.1% |
| Immigrants | Micronesia | 0.0 /100 | #279 | Tragic 81.1% |
| Immigrants | Latin America | 0.0 /100 | #280 | Tragic 81.0% |
| Immigrants | Grenada | 0.0 /100 | #281 | Tragic 81.0% |
| Aleuts | 0.0 /100 | #282 | Tragic 81.0% |
Demographics Similar to Lithuanians by In Labor Force | Age 45-54
In terms of in labor force | age 45-54, the demographic groups most similar to Lithuanians are Burmese (83.6%, a difference of 0.010%), Immigrants from Hong Kong (83.6%, a difference of 0.010%), Croatian (83.6%, a difference of 0.010%), Immigrants from Poland (83.6%, a difference of 0.020%), and Immigrants from Morocco (83.6%, a difference of 0.020%).
| Demographics | Rating | Rank | In Labor Force | Age 45-54 |
| Immigrants | Cuba | 99.4 /100 | #39 | Exceptional 83.7% |
| Immigrants | Uganda | 99.4 /100 | #40 | Exceptional 83.7% |
| Immigrants | Korea | 99.3 /100 | #41 | Exceptional 83.7% |
| Immigrants | Moldova | 99.3 /100 | #42 | Exceptional 83.7% |
| Venezuelans | 99.2 /100 | #43 | Exceptional 83.6% |
| Burmese | 99.1 /100 | #44 | Exceptional 83.6% |
| Immigrants | Hong Kong | 99.1 /100 | #45 | Exceptional 83.6% |
| Lithuanians | 99.1 /100 | #46 | Exceptional 83.6% |
| Croatians | 99.0 /100 | #47 | Exceptional 83.6% |
| Immigrants | Poland | 99.0 /100 | #48 | Exceptional 83.6% |
| Immigrants | Morocco | 99.0 /100 | #49 | Exceptional 83.6% |
| Immigrants | Greece | 98.8 /100 | #50 | Exceptional 83.6% |
| Immigrants | Turkey | 98.8 /100 | #51 | Exceptional 83.6% |
| Poles | 98.7 /100 | #52 | Exceptional 83.6% |
| Peruvians | 98.7 /100 | #53 | Exceptional 83.6% |