Bhutanese vs Cambodian Child Poverty Under the Age of 16
COMPARE
Bhutanese
Cambodian
Child Poverty Under the Age of 16
Child Poverty Under the Age of 16 Comparison
Bhutanese
Cambodians
12.5%
CHILD POVERTY UNDER THE AGE OF 16
99.9/ 100
METRIC RATING
11th/ 347
METRIC RANK
14.4%
CHILD POVERTY UNDER THE AGE OF 16
97.8/ 100
METRIC RATING
72nd/ 347
METRIC RANK
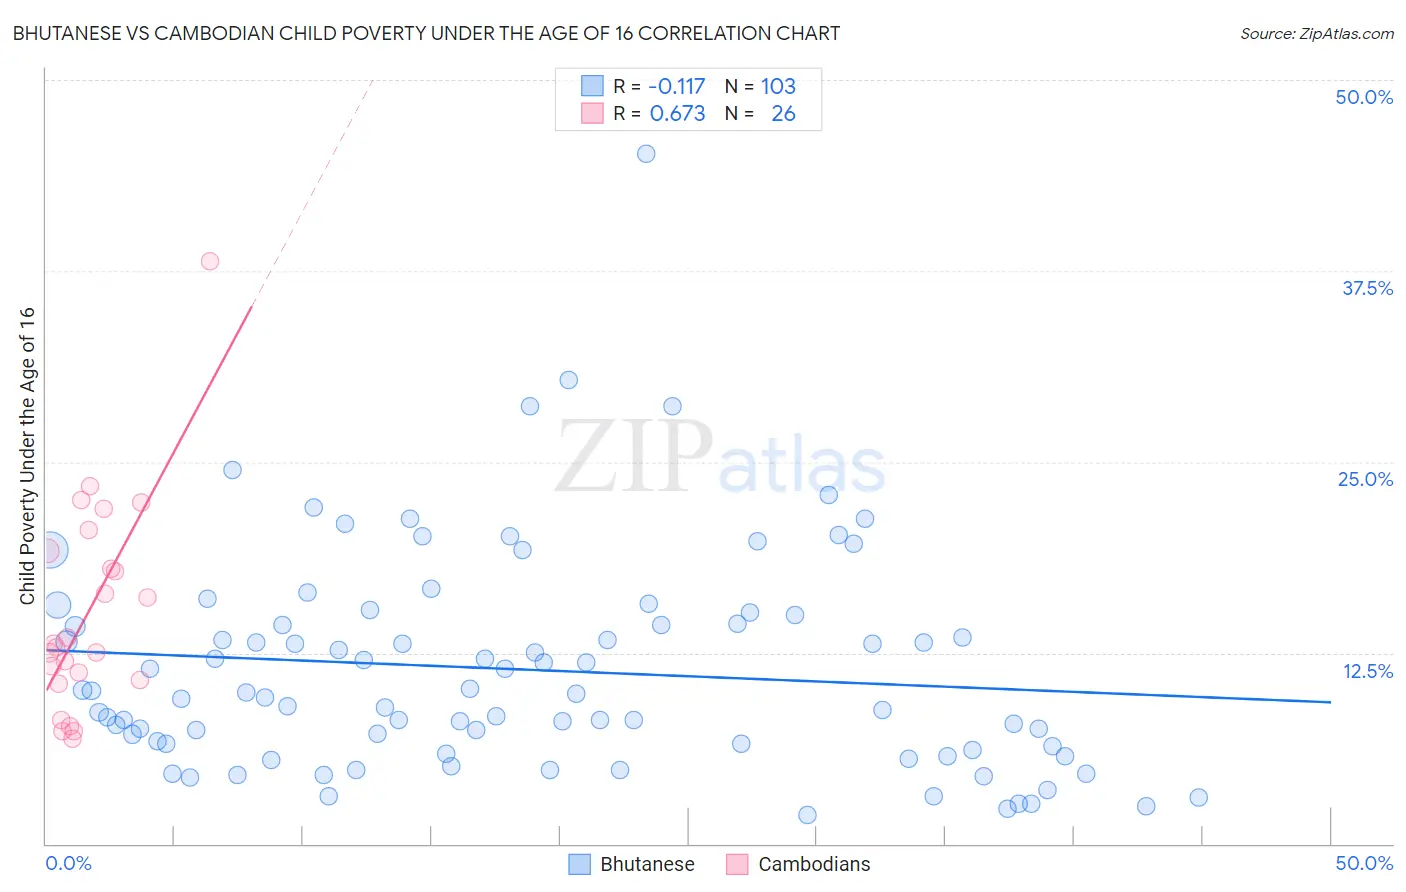
Bhutanese vs Cambodian Child Poverty Under the Age of 16 Correlation Chart
The statistical analysis conducted on geographies consisting of 450,361,741 people shows a poor negative correlation between the proportion of Bhutanese and poverty level among children under the age of 16 in the United States with a correlation coefficient (R) of -0.117 and weighted average of 12.5%. Similarly, the statistical analysis conducted on geographies consisting of 102,284,203 people shows a significant positive correlation between the proportion of Cambodians and poverty level among children under the age of 16 in the United States with a correlation coefficient (R) of 0.673 and weighted average of 14.4%, a difference of 14.7%.
Child Poverty Under the Age of 16 Correlation Summary
| Measurement | Bhutanese | Cambodian |
| Minimum | 1.9% | 6.8% |
| Maximum | 45.2% | 38.1% |
| Range | 43.3% | 31.2% |
| Mean | 11.4% | 15.2% |
| Median | 9.8% | 13.0% |
| Interquartile 25% (IQ1) | 6.4% | 10.7% |
| Interquartile 75% (IQ3) | 14.4% | 19.2% |
| Interquartile Range (IQR) | 8.1% | 8.4% |
| Standard Deviation (Sample) | 7.1% | 7.0% |
| Standard Deviation (Population) | 7.1% | 6.8% |
Similar Demographics by Child Poverty Under the Age of 16
Demographics Similar to Bhutanese by Child Poverty Under the Age of 16
In terms of child poverty under the age of 16, the demographic groups most similar to Bhutanese are Immigrants from South Central Asia (12.5%, a difference of 0.010%), Immigrants from Ireland (12.7%, a difference of 1.1%), Immigrants from Iran (12.4%, a difference of 1.2%), Immigrants from Singapore (12.4%, a difference of 1.3%), and Burmese (12.8%, a difference of 2.2%).
| Demographics | Rating | Rank | Child Poverty Under the Age of 16 |
| Thais | 100.0 /100 | #4 | Exceptional 11.6% |
| Chinese | 100.0 /100 | #5 | Exceptional 11.9% |
| Immigrants | Hong Kong | 100.0 /100 | #6 | Exceptional 12.1% |
| Iranians | 100.0 /100 | #7 | Exceptional 12.2% |
| Immigrants | Singapore | 100.0 /100 | #8 | Exceptional 12.4% |
| Immigrants | Iran | 100.0 /100 | #9 | Exceptional 12.4% |
| Immigrants | South Central Asia | 99.9 /100 | #10 | Exceptional 12.5% |
| Bhutanese | 99.9 /100 | #11 | Exceptional 12.5% |
| Immigrants | Ireland | 99.9 /100 | #12 | Exceptional 12.7% |
| Burmese | 99.9 /100 | #13 | Exceptional 12.8% |
| Immigrants | Lithuania | 99.9 /100 | #14 | Exceptional 12.9% |
| Immigrants | Korea | 99.9 /100 | #15 | Exceptional 13.0% |
| Norwegians | 99.9 /100 | #16 | Exceptional 13.0% |
| Bulgarians | 99.9 /100 | #17 | Exceptional 13.0% |
| Cypriots | 99.9 /100 | #18 | Exceptional 13.0% |
Demographics Similar to Cambodians by Child Poverty Under the Age of 16
In terms of child poverty under the age of 16, the demographic groups most similar to Cambodians are Immigrants from Turkey (14.4%, a difference of 0.21%), Macedonian (14.4%, a difference of 0.21%), Immigrants from Poland (14.3%, a difference of 0.22%), Immigrants from Netherlands (14.3%, a difference of 0.23%), and Immigrants from Bulgaria (14.3%, a difference of 0.33%).
| Demographics | Rating | Rank | Child Poverty Under the Age of 16 |
| Immigrants | Philippines | 98.2 /100 | #65 | Exceptional 14.3% |
| Slovenes | 98.1 /100 | #66 | Exceptional 14.3% |
| Europeans | 98.1 /100 | #67 | Exceptional 14.3% |
| Laotians | 98.0 /100 | #68 | Exceptional 14.3% |
| Immigrants | Bulgaria | 98.0 /100 | #69 | Exceptional 14.3% |
| Immigrants | Netherlands | 97.9 /100 | #70 | Exceptional 14.3% |
| Immigrants | Poland | 97.9 /100 | #71 | Exceptional 14.3% |
| Cambodians | 97.8 /100 | #72 | Exceptional 14.4% |
| Immigrants | Turkey | 97.6 /100 | #73 | Exceptional 14.4% |
| Macedonians | 97.6 /100 | #74 | Exceptional 14.4% |
| Ukrainians | 97.5 /100 | #75 | Exceptional 14.4% |
| Immigrants | Eastern Europe | 97.5 /100 | #76 | Exceptional 14.4% |
| Australians | 97.5 /100 | #77 | Exceptional 14.4% |
| Immigrants | Russia | 97.3 /100 | #78 | Exceptional 14.5% |
| Swiss | 97.3 /100 | #79 | Exceptional 14.5% |