Bhutanese vs Cambodian Householder Income Ages 45 - 64 years
COMPARE
Bhutanese
Cambodian
Householder Income Ages 45 - 64 years
Householder Income Ages 45 - 64 years Comparison
Bhutanese
Cambodians
$117,750
HOUSEHOLDER INCOME AGES 45 - 64 YEARS
100.0/ 100
METRIC RATING
29th/ 347
METRIC RANK
$114,342
HOUSEHOLDER INCOME AGES 45 - 64 YEARS
99.9/ 100
METRIC RATING
40th/ 347
METRIC RANK
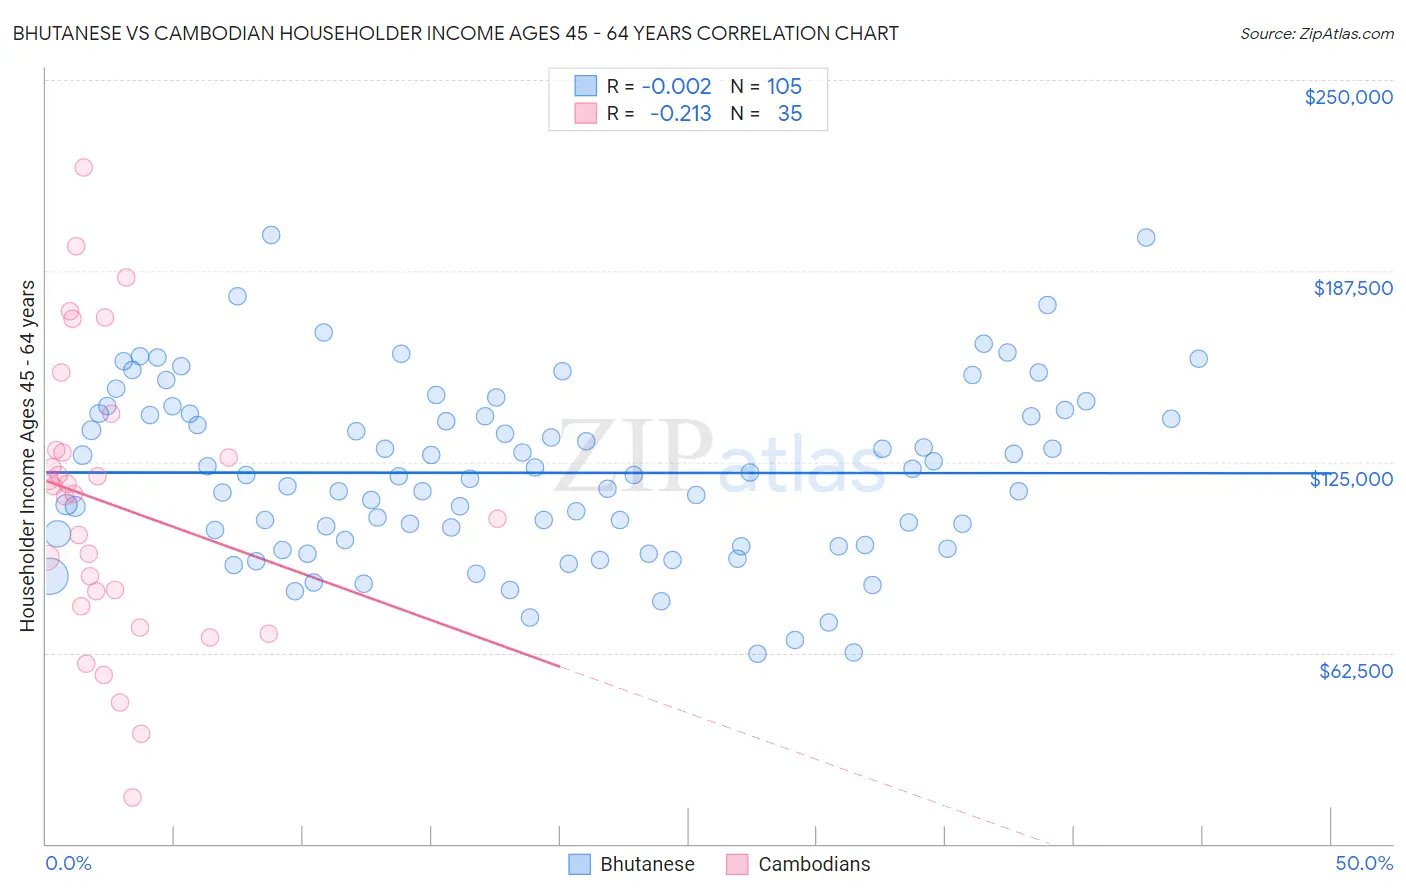
Bhutanese vs Cambodian Householder Income Ages 45 - 64 years Correlation Chart
The statistical analysis conducted on geographies consisting of 454,365,624 people shows no correlation between the proportion of Bhutanese and household income with householder between the ages 45 and 64 in the United States with a correlation coefficient (R) of -0.002 and weighted average of $117,750. Similarly, the statistical analysis conducted on geographies consisting of 102,430,914 people shows a weak negative correlation between the proportion of Cambodians and household income with householder between the ages 45 and 64 in the United States with a correlation coefficient (R) of -0.213 and weighted average of $114,342, a difference of 3.0%.
Householder Income Ages 45 - 64 years Correlation Summary
| Measurement | Bhutanese | Cambodian |
| Minimum | $62,115 | $15,079 |
| Maximum | $199,389 | $221,500 |
| Range | $137,274 | $206,421 |
| Mean | $121,425 | $111,198 |
| Median | $120,522 | $114,622 |
| Interquartile 25% (IQ1) | $98,623 | $77,671 |
| Interquartile 75% (IQ3) | $140,769 | $128,994 |
| Interquartile Range (IQR) | $42,146 | $51,323 |
| Standard Deviation (Sample) | $28,538 | $46,823 |
| Standard Deviation (Population) | $28,402 | $46,149 |
Demographics Similar to Bhutanese and Cambodians by Householder Income Ages 45 - 64 years
In terms of householder income ages 45 - 64 years, the demographic groups most similar to Bhutanese are Immigrants from Bolivia ($117,731, a difference of 0.020%), Turkish ($117,814, a difference of 0.050%), Immigrants from Northern Europe ($117,930, a difference of 0.15%), Immigrants from Sweden ($118,318, a difference of 0.48%), and Asian ($118,426, a difference of 0.57%). Similarly, the demographic groups most similar to Cambodians are Immigrants from Lithuania ($114,336, a difference of 0.010%), Immigrants from Turkey ($114,407, a difference of 0.060%), Immigrants from Pakistan ($114,434, a difference of 0.080%), Estonian ($114,220, a difference of 0.11%), and Israeli ($114,186, a difference of 0.14%).
| Demographics | Rating | Rank | Householder Income Ages 45 - 64 years |
| Immigrants | Japan | 100.0 /100 | #24 | Exceptional $118,498 |
| Asians | 100.0 /100 | #25 | Exceptional $118,426 |
| Immigrants | Sweden | 100.0 /100 | #26 | Exceptional $118,318 |
| Immigrants | Northern Europe | 100.0 /100 | #27 | Exceptional $117,930 |
| Turks | 100.0 /100 | #28 | Exceptional $117,814 |
| Bhutanese | 100.0 /100 | #29 | Exceptional $117,750 |
| Immigrants | Bolivia | 100.0 /100 | #30 | Exceptional $117,731 |
| Immigrants | Asia | 100.0 /100 | #31 | Exceptional $116,566 |
| Russians | 100.0 /100 | #32 | Exceptional $116,328 |
| Chinese | 100.0 /100 | #33 | Exceptional $116,156 |
| Immigrants | Denmark | 100.0 /100 | #34 | Exceptional $116,000 |
| Latvians | 100.0 /100 | #35 | Exceptional $115,957 |
| Immigrants | Switzerland | 100.0 /100 | #36 | Exceptional $115,934 |
| Maltese | 99.9 /100 | #37 | Exceptional $114,754 |
| Immigrants | Pakistan | 99.9 /100 | #38 | Exceptional $114,434 |
| Immigrants | Turkey | 99.9 /100 | #39 | Exceptional $114,407 |
| Cambodians | 99.9 /100 | #40 | Exceptional $114,342 |
| Immigrants | Lithuania | 99.9 /100 | #41 | Exceptional $114,336 |
| Estonians | 99.9 /100 | #42 | Exceptional $114,220 |
| Israelis | 99.9 /100 | #43 | Exceptional $114,186 |
| Bulgarians | 99.9 /100 | #44 | Exceptional $113,883 |