Bermudan vs Immigrants from Germany In Labor Force | Age 25-29
COMPARE
Bermudan
Immigrants from Germany
In Labor Force | Age 25-29
In Labor Force | Age 25-29 Comparison
Bermudans
Immigrants from Germany
86.0%
IN LABOR FORCE | AGE 25-29
100.0/ 100
METRIC RATING
17th/ 347
METRIC RANK
84.4%
IN LABOR FORCE | AGE 25-29
18.3/ 100
METRIC RATING
199th/ 347
METRIC RANK
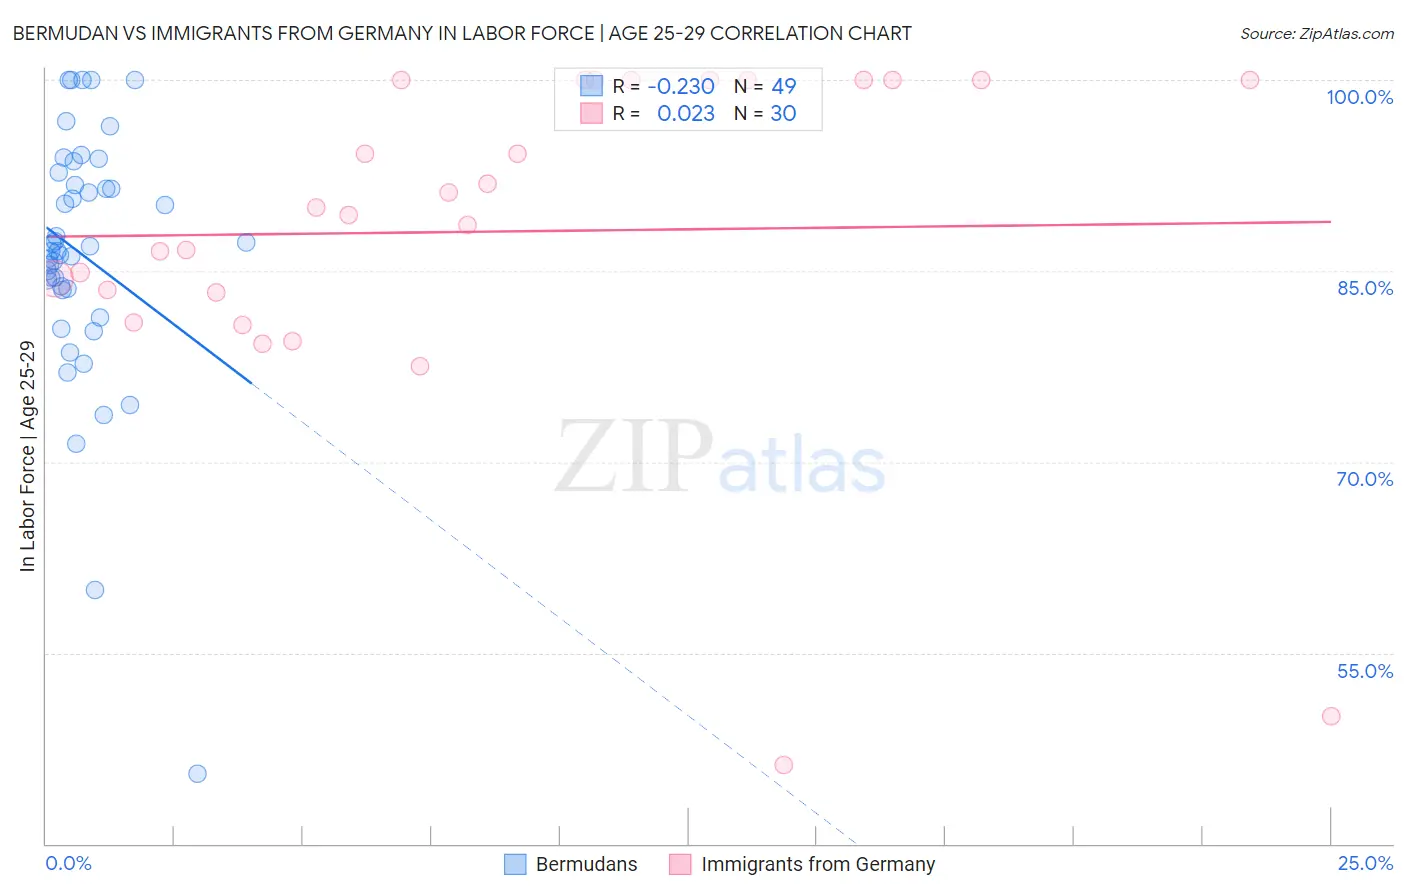
Bermudan vs Immigrants from Germany In Labor Force | Age 25-29 Correlation Chart
The statistical analysis conducted on geographies consisting of 55,723,505 people shows a weak negative correlation between the proportion of Bermudans and labor force participation rate among population between the ages 25 and 29 in the United States with a correlation coefficient (R) of -0.230 and weighted average of 86.0%. Similarly, the statistical analysis conducted on geographies consisting of 463,583,295 people shows no correlation between the proportion of Immigrants from Germany and labor force participation rate among population between the ages 25 and 29 in the United States with a correlation coefficient (R) of 0.023 and weighted average of 84.4%, a difference of 1.9%.
In Labor Force | Age 25-29 Correlation Summary
| Measurement | Bermudan | Immigrants from Germany |
| Minimum | 45.5% | 46.2% |
| Maximum | 100.0% | 100.0% |
| Range | 54.5% | 53.8% |
| Mean | 86.3% | 88.1% |
| Median | 86.6% | 89.7% |
| Interquartile 25% (IQ1) | 83.5% | 83.3% |
| Interquartile 75% (IQ3) | 92.2% | 100.0% |
| Interquartile Range (IQR) | 8.7% | 16.7% |
| Standard Deviation (Sample) | 10.0% | 13.4% |
| Standard Deviation (Population) | 9.9% | 13.1% |
Similar Demographics by In Labor Force | Age 25-29
Demographics Similar to Bermudans by In Labor Force | Age 25-29
In terms of in labor force | age 25-29, the demographic groups most similar to Bermudans are Bulgarian (86.0%, a difference of 0.030%), Immigrants from Bolivia (86.1%, a difference of 0.040%), Cape Verdean (86.0%, a difference of 0.040%), Latvian (86.1%, a difference of 0.050%), and Bolivian (86.1%, a difference of 0.050%).
| Demographics | Rating | Rank | In Labor Force | Age 25-29 |
| Liberians | 100.0 /100 | #10 | Exceptional 86.1% |
| Immigrants | Ethiopia | 100.0 /100 | #11 | Exceptional 86.1% |
| Immigrants | Lithuania | 100.0 /100 | #12 | Exceptional 86.1% |
| Norwegians | 100.0 /100 | #13 | Exceptional 86.1% |
| Latvians | 100.0 /100 | #14 | Exceptional 86.1% |
| Bolivians | 100.0 /100 | #15 | Exceptional 86.1% |
| Immigrants | Bolivia | 100.0 /100 | #16 | Exceptional 86.1% |
| Bermudans | 100.0 /100 | #17 | Exceptional 86.0% |
| Bulgarians | 100.0 /100 | #18 | Exceptional 86.0% |
| Cape Verdeans | 100.0 /100 | #19 | Exceptional 86.0% |
| Immigrants | Ireland | 100.0 /100 | #20 | Exceptional 86.0% |
| Maltese | 100.0 /100 | #21 | Exceptional 86.0% |
| Cambodians | 100.0 /100 | #22 | Exceptional 86.0% |
| Immigrants | Uganda | 100.0 /100 | #23 | Exceptional 86.0% |
| Immigrants | Eastern Africa | 100.0 /100 | #24 | Exceptional 86.0% |
Demographics Similar to Immigrants from Germany by In Labor Force | Age 25-29
In terms of in labor force | age 25-29, the demographic groups most similar to Immigrants from Germany are Immigrants from South Eastern Asia (84.4%, a difference of 0.010%), Tlingit-Haida (84.4%, a difference of 0.010%), Immigrants from Iraq (84.4%, a difference of 0.010%), Immigrants from Kazakhstan (84.4%, a difference of 0.010%), and Laotian (84.4%, a difference of 0.020%).
| Demographics | Rating | Rank | In Labor Force | Age 25-29 |
| English | 25.8 /100 | #192 | Fair 84.5% |
| South American Indians | 25.0 /100 | #193 | Fair 84.5% |
| Portuguese | 21.2 /100 | #194 | Fair 84.4% |
| Immigrants | Israel | 20.8 /100 | #195 | Fair 84.4% |
| Immigrants | South Eastern Asia | 19.5 /100 | #196 | Poor 84.4% |
| Tlingit-Haida | 19.3 /100 | #197 | Poor 84.4% |
| Immigrants | Iraq | 19.0 /100 | #198 | Poor 84.4% |
| Immigrants | Germany | 18.3 /100 | #199 | Poor 84.4% |
| Immigrants | Kazakhstan | 17.5 /100 | #200 | Poor 84.4% |
| Laotians | 16.6 /100 | #201 | Poor 84.4% |
| Afghans | 15.9 /100 | #202 | Poor 84.4% |
| Immigrants | Afghanistan | 15.6 /100 | #203 | Poor 84.4% |
| Venezuelans | 15.1 /100 | #204 | Poor 84.4% |
| Ecuadorians | 14.8 /100 | #205 | Poor 84.4% |
| Immigrants | Cambodia | 14.3 /100 | #206 | Poor 84.4% |