Bermudan vs Sri Lankan In Labor Force | Age > 16
COMPARE
Bermudan
Sri Lankan
In Labor Force | Age > 16
In Labor Force | Age > 16 Comparison
Bermudans
Sri Lankans
66.0%
IN LABOR FORCE | AGE > 16
99.3/ 100
METRIC RATING
88th/ 347
METRIC RANK
66.3%
IN LABOR FORCE | AGE > 16
99.8/ 100
METRIC RATING
65th/ 347
METRIC RANK
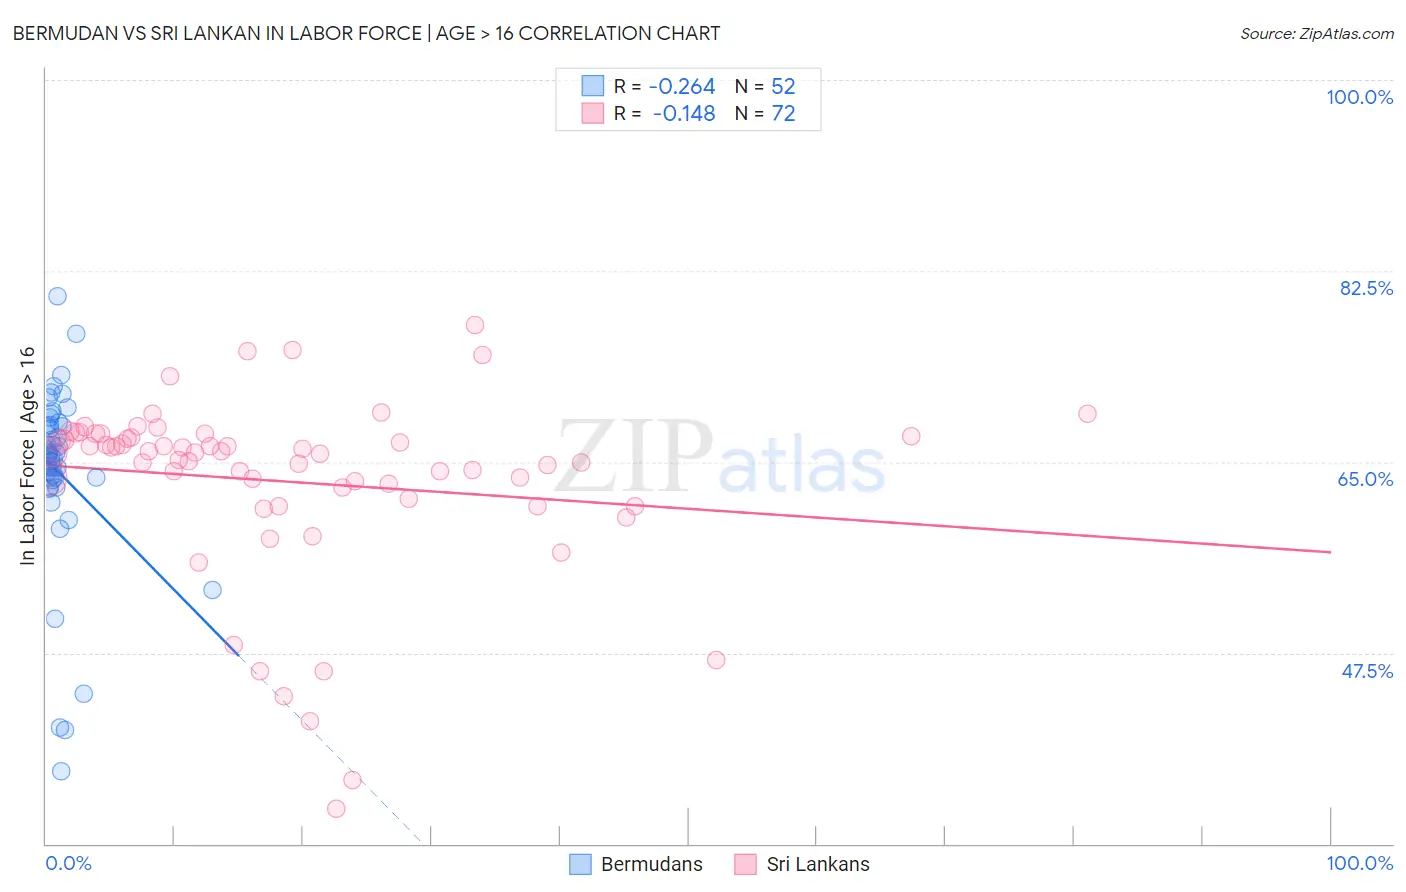
Bermudan vs Sri Lankan In Labor Force | Age > 16 Correlation Chart
The statistical analysis conducted on geographies consisting of 55,730,379 people shows a weak negative correlation between the proportion of Bermudans and labor force participation rate among population ages 16 and over in the United States with a correlation coefficient (R) of -0.264 and weighted average of 66.0%. Similarly, the statistical analysis conducted on geographies consisting of 440,615,850 people shows a poor negative correlation between the proportion of Sri Lankans and labor force participation rate among population ages 16 and over in the United States with a correlation coefficient (R) of -0.148 and weighted average of 66.3%, a difference of 0.35%.
In Labor Force | Age > 16 Correlation Summary
| Measurement | Bermudan | Sri Lankan |
| Minimum | 36.6% | 33.2% |
| Maximum | 80.2% | 77.6% |
| Range | 43.6% | 44.4% |
| Mean | 64.1% | 63.2% |
| Median | 65.6% | 65.8% |
| Interquartile 25% (IQ1) | 63.4% | 62.1% |
| Interquartile 75% (IQ3) | 68.3% | 67.2% |
| Interquartile Range (IQR) | 4.9% | 5.1% |
| Standard Deviation (Sample) | 8.4% | 8.5% |
| Standard Deviation (Population) | 8.3% | 8.4% |
Similar Demographics by In Labor Force | Age > 16
Demographics Similar to Bermudans by In Labor Force | Age > 16
In terms of in labor force | age > 16, the demographic groups most similar to Bermudans are South American Indian (66.0%, a difference of 0.0%), South American (66.0%, a difference of 0.010%), Mongolian (66.1%, a difference of 0.030%), Immigrants from Jordan (66.1%, a difference of 0.040%), and Central American (66.1%, a difference of 0.040%).
| Demographics | Rating | Rank | In Labor Force | Age > 16 |
| Moroccans | 99.5 /100 | #81 | Exceptional 66.1% |
| German Russians | 99.4 /100 | #82 | Exceptional 66.1% |
| Immigrants | Jordan | 99.4 /100 | #83 | Exceptional 66.1% |
| Central Americans | 99.4 /100 | #84 | Exceptional 66.1% |
| Mongolians | 99.4 /100 | #85 | Exceptional 66.1% |
| South Americans | 99.4 /100 | #86 | Exceptional 66.0% |
| South American Indians | 99.4 /100 | #87 | Exceptional 66.0% |
| Bermudans | 99.3 /100 | #88 | Exceptional 66.0% |
| Immigrants | Laos | 99.2 /100 | #89 | Exceptional 66.0% |
| Chileans | 99.2 /100 | #90 | Exceptional 66.0% |
| Iranians | 99.2 /100 | #91 | Exceptional 66.0% |
| Aleuts | 99.1 /100 | #92 | Exceptional 66.0% |
| Immigrants | South America | 99.1 /100 | #93 | Exceptional 66.0% |
| Immigrants | Cambodia | 99.1 /100 | #94 | Exceptional 66.0% |
| Immigrants | Uruguay | 99.1 /100 | #95 | Exceptional 66.0% |
Demographics Similar to Sri Lankans by In Labor Force | Age > 16
In terms of in labor force | age > 16, the demographic groups most similar to Sri Lankans are Venezuelan (66.3%, a difference of 0.010%), Peruvian (66.3%, a difference of 0.010%), Jordanian (66.3%, a difference of 0.020%), Immigrants from Peru (66.3%, a difference of 0.050%), and Immigrants from Burma/Myanmar (66.3%, a difference of 0.050%).
| Demographics | Rating | Rank | In Labor Force | Age > 16 |
| Immigrants | Saudi Arabia | 99.9 /100 | #58 | Exceptional 66.3% |
| Immigrants | Turkey | 99.9 /100 | #59 | Exceptional 66.3% |
| Immigrants | Peru | 99.8 /100 | #60 | Exceptional 66.3% |
| Immigrants | Burma/Myanmar | 99.8 /100 | #61 | Exceptional 66.3% |
| Indonesians | 99.8 /100 | #62 | Exceptional 66.3% |
| Venezuelans | 99.8 /100 | #63 | Exceptional 66.3% |
| Peruvians | 99.8 /100 | #64 | Exceptional 66.3% |
| Sri Lankans | 99.8 /100 | #65 | Exceptional 66.3% |
| Jordanians | 99.8 /100 | #66 | Exceptional 66.3% |
| Egyptians | 99.8 /100 | #67 | Exceptional 66.2% |
| Immigrants | Egypt | 99.7 /100 | #68 | Exceptional 66.2% |
| Sub-Saharan Africans | 99.7 /100 | #69 | Exceptional 66.2% |
| Asians | 99.7 /100 | #70 | Exceptional 66.2% |
| Burmese | 99.7 /100 | #71 | Exceptional 66.2% |
| Taiwanese | 99.7 /100 | #72 | Exceptional 66.2% |