Bermudan vs Immigrants from Burma/Myanmar In Labor Force | Age 30-34
COMPARE
Bermudan
Immigrants from Burma/Myanmar
In Labor Force | Age 30-34
In Labor Force | Age 30-34 Comparison
Bermudans
Immigrants from Burma/Myanmar
85.9%
IN LABOR FORCE | AGE 30-34
100.0/ 100
METRIC RATING
22nd/ 347
METRIC RANK
84.7%
IN LABOR FORCE | AGE 30-34
52.0/ 100
METRIC RATING
170th/ 347
METRIC RANK
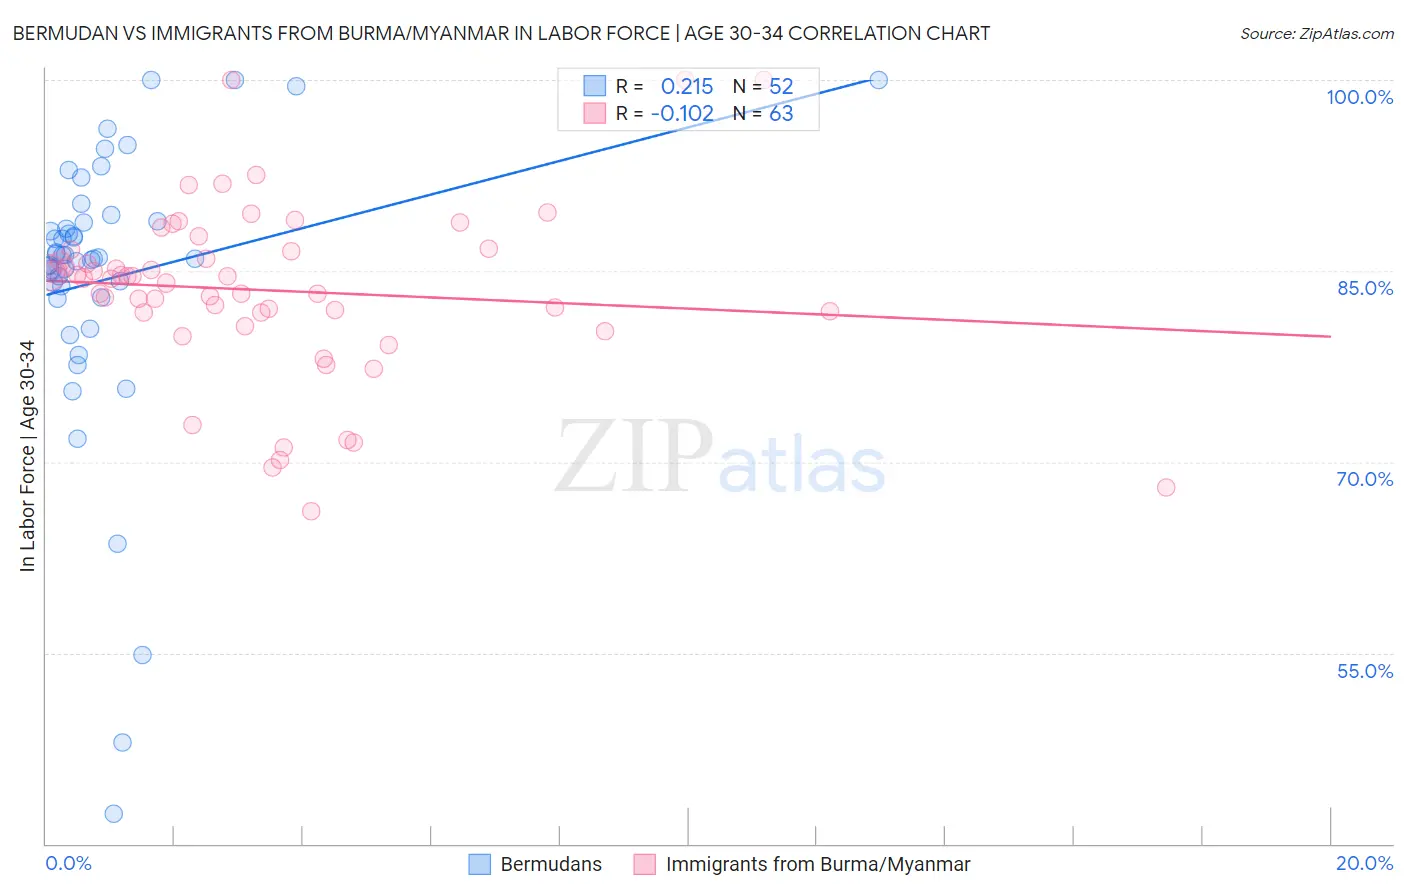
Bermudan vs Immigrants from Burma/Myanmar In Labor Force | Age 30-34 Correlation Chart
The statistical analysis conducted on geographies consisting of 55,725,453 people shows a weak positive correlation between the proportion of Bermudans and labor force participation rate among population between the ages 30 and 34 in the United States with a correlation coefficient (R) of 0.215 and weighted average of 85.9%. Similarly, the statistical analysis conducted on geographies consisting of 172,303,659 people shows a poor negative correlation between the proportion of Immigrants from Burma/Myanmar and labor force participation rate among population between the ages 30 and 34 in the United States with a correlation coefficient (R) of -0.102 and weighted average of 84.7%, a difference of 1.5%.
In Labor Force | Age 30-34 Correlation Summary
| Measurement | Bermudan | Immigrants from Burma/Myanmar |
| Minimum | 42.4% | 66.1% |
| Maximum | 100.0% | 100.0% |
| Range | 57.6% | 33.9% |
| Mean | 84.4% | 83.5% |
| Median | 86.0% | 84.4% |
| Interquartile 25% (IQ1) | 83.3% | 81.8% |
| Interquartile 75% (IQ3) | 88.8% | 86.7% |
| Interquartile Range (IQR) | 5.5% | 4.9% |
| Standard Deviation (Sample) | 11.4% | 6.9% |
| Standard Deviation (Population) | 11.2% | 6.9% |
Similar Demographics by In Labor Force | Age 30-34
Demographics Similar to Bermudans by In Labor Force | Age 30-34
In terms of in labor force | age 30-34, the demographic groups most similar to Bermudans are Estonian (85.9%, a difference of 0.0%), Immigrants from Eritrea (85.9%, a difference of 0.010%), Bulgarian (86.0%, a difference of 0.020%), Immigrants from Bulgaria (86.0%, a difference of 0.020%), and Immigrants from North Macedonia (85.9%, a difference of 0.020%).
| Demographics | Rating | Rank | In Labor Force | Age 30-34 |
| Immigrants | Albania | 100.0 /100 | #15 | Exceptional 86.1% |
| Latvians | 100.0 /100 | #16 | Exceptional 86.0% |
| Immigrants | Cameroon | 100.0 /100 | #17 | Exceptional 86.0% |
| Immigrants | Sierra Leone | 100.0 /100 | #18 | Exceptional 86.0% |
| Sierra Leoneans | 100.0 /100 | #19 | Exceptional 86.0% |
| Bulgarians | 100.0 /100 | #20 | Exceptional 86.0% |
| Immigrants | Bulgaria | 100.0 /100 | #21 | Exceptional 86.0% |
| Bermudans | 100.0 /100 | #22 | Exceptional 85.9% |
| Estonians | 100.0 /100 | #23 | Exceptional 85.9% |
| Immigrants | Eritrea | 100.0 /100 | #24 | Exceptional 85.9% |
| Immigrants | North Macedonia | 100.0 /100 | #25 | Exceptional 85.9% |
| Immigrants | Eastern Africa | 100.0 /100 | #26 | Exceptional 85.9% |
| Immigrants | Liberia | 100.0 /100 | #27 | Exceptional 85.9% |
| Immigrants | Latvia | 100.0 /100 | #28 | Exceptional 85.9% |
| Tsimshian | 100.0 /100 | #29 | Exceptional 85.8% |
Demographics Similar to Immigrants from Burma/Myanmar by In Labor Force | Age 30-34
In terms of in labor force | age 30-34, the demographic groups most similar to Immigrants from Burma/Myanmar are Immigrants from Peru (84.7%, a difference of 0.0%), South American Indian (84.7%, a difference of 0.0%), Irish (84.7%, a difference of 0.0%), Immigrants from England (84.7%, a difference of 0.0%), and Israeli (84.7%, a difference of 0.010%).
| Demographics | Rating | Rank | In Labor Force | Age 30-34 |
| Immigrants | Uruguay | 57.4 /100 | #163 | Average 84.7% |
| Icelanders | 56.8 /100 | #164 | Average 84.7% |
| Immigrants | Western Europe | 56.7 /100 | #165 | Average 84.7% |
| Afghans | 55.2 /100 | #166 | Average 84.7% |
| Immigrants | South Eastern Asia | 54.2 /100 | #167 | Average 84.7% |
| Immigrants | Peru | 52.4 /100 | #168 | Average 84.7% |
| South American Indians | 52.1 /100 | #169 | Average 84.7% |
| Immigrants | Burma/Myanmar | 52.0 /100 | #170 | Average 84.7% |
| Irish | 52.0 /100 | #171 | Average 84.7% |
| Immigrants | England | 51.7 /100 | #172 | Average 84.7% |
| Israelis | 51.1 /100 | #173 | Average 84.7% |
| Finns | 50.0 /100 | #174 | Average 84.7% |
| Immigrants | South America | 50.0 /100 | #175 | Average 84.7% |
| Immigrants | Uzbekistan | 49.1 /100 | #176 | Average 84.7% |
| Laotians | 46.9 /100 | #177 | Average 84.7% |