Bermudan vs Immigrants from Denmark Master's Degree
COMPARE
Bermudan
Immigrants from Denmark
Master's Degree
Master's Degree Comparison
Bermudans
Immigrants from Denmark
15.4%
MASTER'S DEGREE
73.9/ 100
METRIC RATING
156th/ 347
METRIC RANK
19.5%
MASTER'S DEGREE
100.0/ 100
METRIC RATING
34th/ 347
METRIC RANK
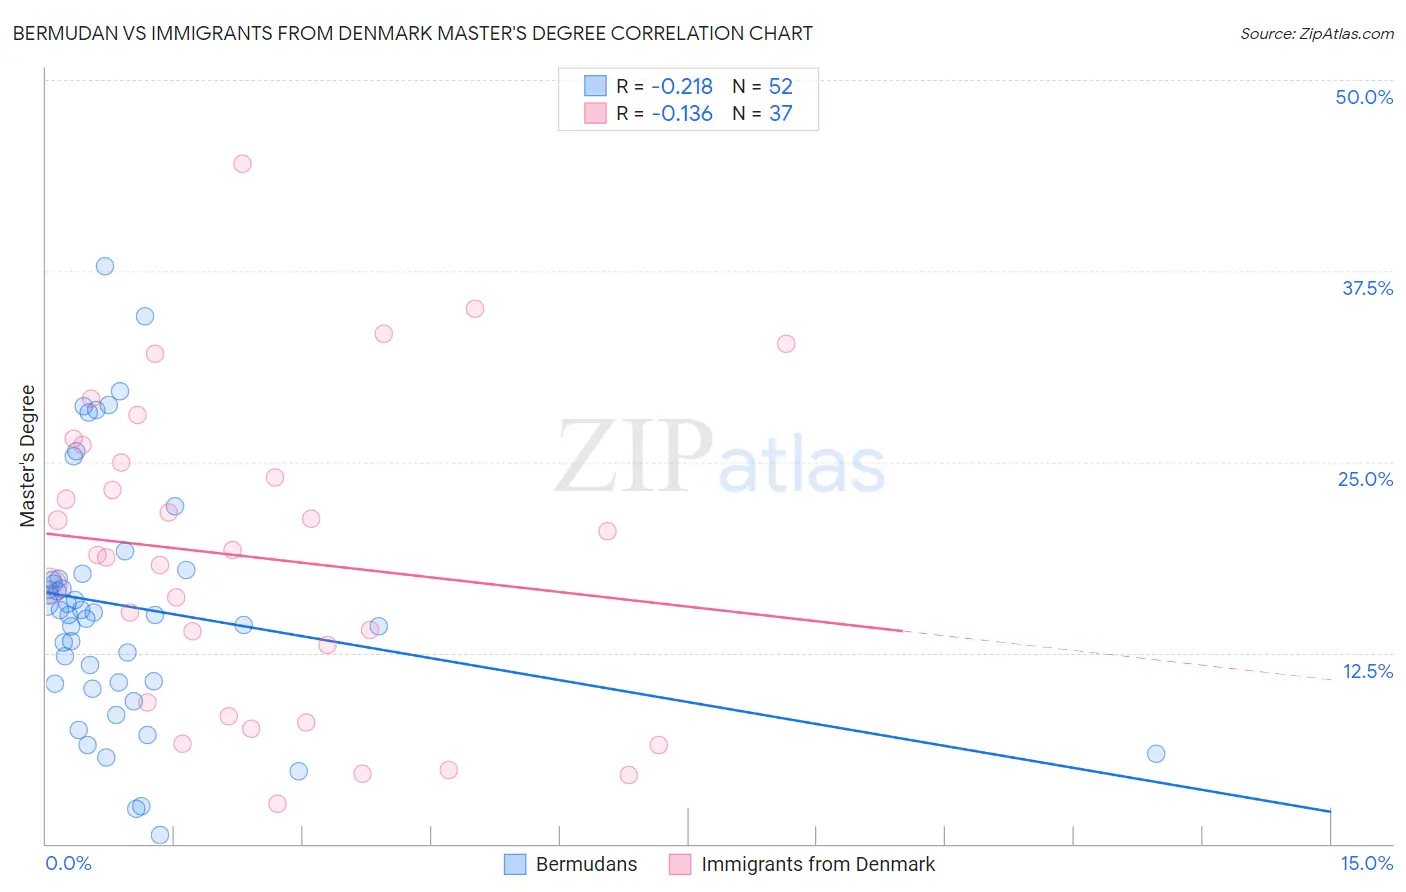
Bermudan vs Immigrants from Denmark Master's Degree Correlation Chart
The statistical analysis conducted on geographies consisting of 55,727,694 people shows a weak negative correlation between the proportion of Bermudans and percentage of population with at least master's degree education in the United States with a correlation coefficient (R) of -0.218 and weighted average of 15.4%. Similarly, the statistical analysis conducted on geographies consisting of 136,426,829 people shows a poor negative correlation between the proportion of Immigrants from Denmark and percentage of population with at least master's degree education in the United States with a correlation coefficient (R) of -0.136 and weighted average of 19.5%, a difference of 26.8%.
Master's Degree Correlation Summary
| Measurement | Bermudan | Immigrants from Denmark |
| Minimum | 0.60% | 2.7% |
| Maximum | 37.8% | 44.5% |
| Range | 37.2% | 41.9% |
| Mean | 15.5% | 18.7% |
| Median | 15.1% | 18.9% |
| Interquartile 25% (IQ1) | 10.5% | 8.8% |
| Interquartile 75% (IQ3) | 17.5% | 25.5% |
| Interquartile Range (IQR) | 7.0% | 16.7% |
| Standard Deviation (Sample) | 8.1% | 10.1% |
| Standard Deviation (Population) | 8.0% | 9.9% |
Similar Demographics by Master's Degree
Demographics Similar to Bermudans by Master's Degree
In terms of master's degree, the demographic groups most similar to Bermudans are Immigrants from Cameroon (15.4%, a difference of 0.35%), Immigrants from Bangladesh (15.5%, a difference of 0.36%), Immigrants from Poland (15.4%, a difference of 0.39%), Immigrants from South America (15.5%, a difference of 0.40%), and Luxembourger (15.3%, a difference of 0.45%).
| Demographics | Rating | Rank | Master's Degree |
| Ghanaians | 78.2 /100 | #149 | Good 15.5% |
| Slovenes | 78.0 /100 | #150 | Good 15.5% |
| Iraqis | 77.3 /100 | #151 | Good 15.5% |
| Slavs | 77.0 /100 | #152 | Good 15.5% |
| Icelanders | 76.8 /100 | #153 | Good 15.5% |
| Immigrants | South America | 76.3 /100 | #154 | Good 15.5% |
| Immigrants | Bangladesh | 76.1 /100 | #155 | Good 15.5% |
| Bermudans | 73.9 /100 | #156 | Good 15.4% |
| Immigrants | Cameroon | 71.7 /100 | #157 | Good 15.4% |
| Immigrants | Poland | 71.5 /100 | #158 | Good 15.4% |
| Luxembourgers | 71.0 /100 | #159 | Good 15.3% |
| Kenyans | 70.3 /100 | #160 | Good 15.3% |
| Sudanese | 68.7 /100 | #161 | Good 15.3% |
| Peruvians | 68.7 /100 | #162 | Good 15.3% |
| Uruguayans | 67.1 /100 | #163 | Good 15.3% |
Demographics Similar to Immigrants from Denmark by Master's Degree
In terms of master's degree, the demographic groups most similar to Immigrants from Denmark are Russian (19.5%, a difference of 0.030%), Immigrants from Northern Europe (19.5%, a difference of 0.33%), Immigrants from Russia (19.4%, a difference of 0.70%), Mongolian (19.4%, a difference of 0.74%), and Burmese (19.7%, a difference of 0.81%).
| Demographics | Rating | Rank | Master's Degree |
| Immigrants | Sri Lanka | 100.0 /100 | #27 | Exceptional 19.9% |
| Turks | 100.0 /100 | #28 | Exceptional 19.9% |
| Latvians | 100.0 /100 | #29 | Exceptional 19.8% |
| Immigrants | Turkey | 100.0 /100 | #30 | Exceptional 19.7% |
| Immigrants | Korea | 100.0 /100 | #31 | Exceptional 19.7% |
| Burmese | 100.0 /100 | #32 | Exceptional 19.7% |
| Russians | 100.0 /100 | #33 | Exceptional 19.5% |
| Immigrants | Denmark | 100.0 /100 | #34 | Exceptional 19.5% |
| Immigrants | Northern Europe | 100.0 /100 | #35 | Exceptional 19.5% |
| Immigrants | Russia | 100.0 /100 | #36 | Exceptional 19.4% |
| Mongolians | 100.0 /100 | #37 | Exceptional 19.4% |
| Bolivians | 100.0 /100 | #38 | Exceptional 19.3% |
| Immigrants | Spain | 100.0 /100 | #39 | Exceptional 19.1% |
| Immigrants | Bolivia | 100.0 /100 | #40 | Exceptional 19.1% |
| Immigrants | Latvia | 100.0 /100 | #41 | Exceptional 19.1% |