Bermudan vs Syrian In Labor Force | Age 25-29
COMPARE
Bermudan
Syrian
In Labor Force | Age 25-29
In Labor Force | Age 25-29 Comparison
Bermudans
Syrians
86.0%
IN LABOR FORCE | AGE 25-29
100.0/ 100
METRIC RATING
17th/ 347
METRIC RANK
84.8%
IN LABOR FORCE | AGE 25-29
76.5/ 100
METRIC RATING
134th/ 347
METRIC RANK
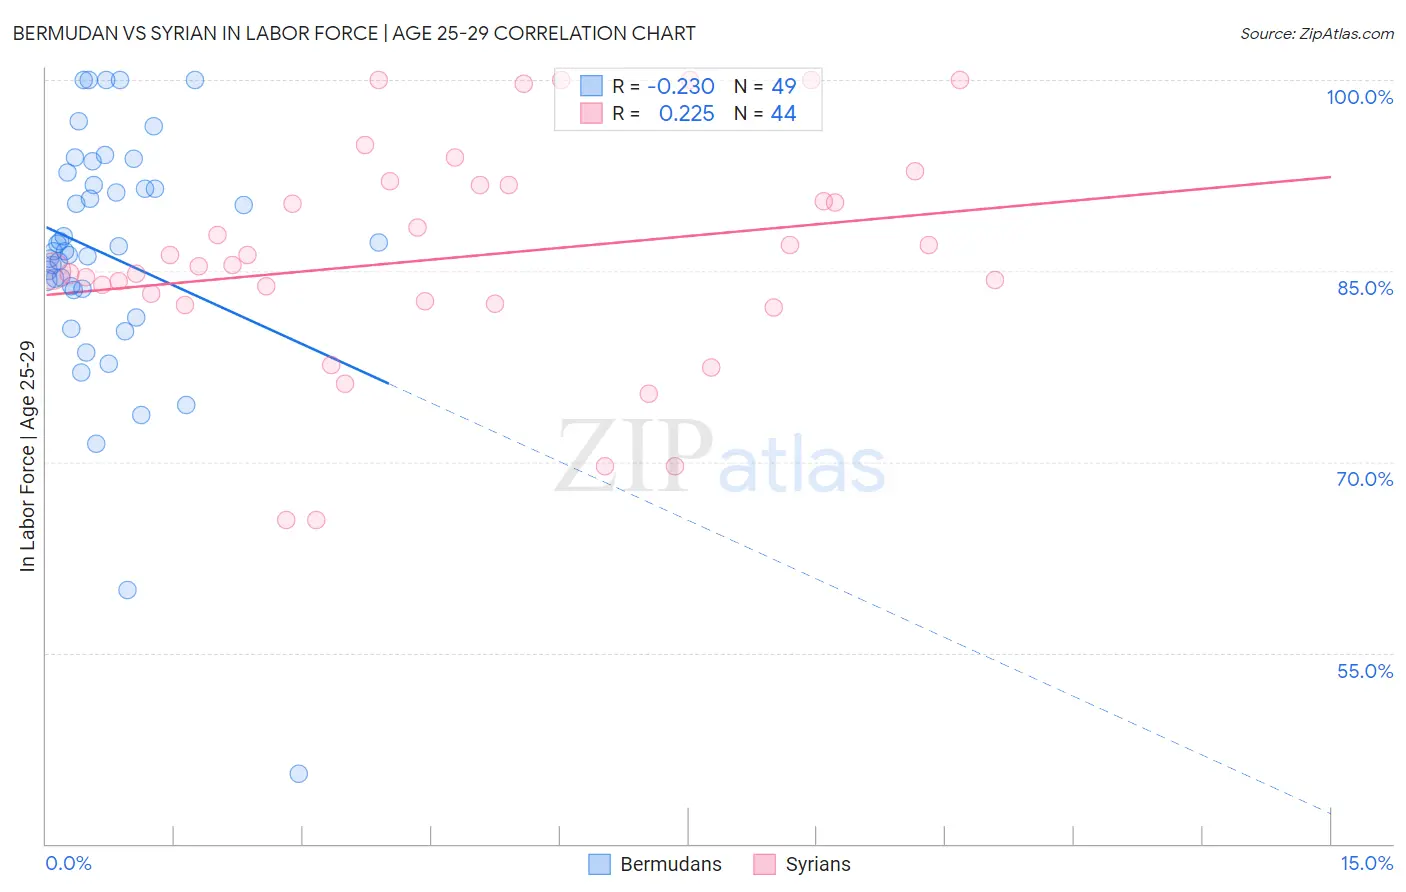
Bermudan vs Syrian In Labor Force | Age 25-29 Correlation Chart
The statistical analysis conducted on geographies consisting of 55,723,505 people shows a weak negative correlation between the proportion of Bermudans and labor force participation rate among population between the ages 25 and 29 in the United States with a correlation coefficient (R) of -0.230 and weighted average of 86.0%. Similarly, the statistical analysis conducted on geographies consisting of 266,239,805 people shows a weak positive correlation between the proportion of Syrians and labor force participation rate among population between the ages 25 and 29 in the United States with a correlation coefficient (R) of 0.225 and weighted average of 84.8%, a difference of 1.4%.
In Labor Force | Age 25-29 Correlation Summary
| Measurement | Bermudan | Syrian |
| Minimum | 45.5% | 65.4% |
| Maximum | 100.0% | 100.0% |
| Range | 54.5% | 34.6% |
| Mean | 86.3% | 86.0% |
| Median | 86.6% | 85.4% |
| Interquartile 25% (IQ1) | 83.5% | 82.5% |
| Interquartile 75% (IQ3) | 92.2% | 91.8% |
| Interquartile Range (IQR) | 8.7% | 9.3% |
| Standard Deviation (Sample) | 10.0% | 8.8% |
| Standard Deviation (Population) | 9.9% | 8.7% |
Similar Demographics by In Labor Force | Age 25-29
Demographics Similar to Bermudans by In Labor Force | Age 25-29
In terms of in labor force | age 25-29, the demographic groups most similar to Bermudans are Bulgarian (86.0%, a difference of 0.030%), Immigrants from Bolivia (86.1%, a difference of 0.040%), Cape Verdean (86.0%, a difference of 0.040%), Latvian (86.1%, a difference of 0.050%), and Bolivian (86.1%, a difference of 0.050%).
| Demographics | Rating | Rank | In Labor Force | Age 25-29 |
| Liberians | 100.0 /100 | #10 | Exceptional 86.1% |
| Immigrants | Ethiopia | 100.0 /100 | #11 | Exceptional 86.1% |
| Immigrants | Lithuania | 100.0 /100 | #12 | Exceptional 86.1% |
| Norwegians | 100.0 /100 | #13 | Exceptional 86.1% |
| Latvians | 100.0 /100 | #14 | Exceptional 86.1% |
| Bolivians | 100.0 /100 | #15 | Exceptional 86.1% |
| Immigrants | Bolivia | 100.0 /100 | #16 | Exceptional 86.1% |
| Bermudans | 100.0 /100 | #17 | Exceptional 86.0% |
| Bulgarians | 100.0 /100 | #18 | Exceptional 86.0% |
| Cape Verdeans | 100.0 /100 | #19 | Exceptional 86.0% |
| Immigrants | Ireland | 100.0 /100 | #20 | Exceptional 86.0% |
| Maltese | 100.0 /100 | #21 | Exceptional 86.0% |
| Cambodians | 100.0 /100 | #22 | Exceptional 86.0% |
| Immigrants | Uganda | 100.0 /100 | #23 | Exceptional 86.0% |
| Immigrants | Eastern Africa | 100.0 /100 | #24 | Exceptional 86.0% |
Demographics Similar to Syrians by In Labor Force | Age 25-29
In terms of in labor force | age 25-29, the demographic groups most similar to Syrians are Immigrants from Hungary (84.8%, a difference of 0.0%), Romanian (84.8%, a difference of 0.010%), Asian (84.8%, a difference of 0.010%), Bhutanese (84.8%, a difference of 0.010%), and Iranian (84.8%, a difference of 0.020%).
| Demographics | Rating | Rank | In Labor Force | Age 25-29 |
| Immigrants | Uruguay | 84.0 /100 | #127 | Excellent 84.9% |
| Australians | 83.6 /100 | #128 | Excellent 84.9% |
| Immigrants | Russia | 81.6 /100 | #129 | Excellent 84.9% |
| Northern Europeans | 81.3 /100 | #130 | Excellent 84.9% |
| Iranians | 78.1 /100 | #131 | Good 84.8% |
| Romanians | 77.7 /100 | #132 | Good 84.8% |
| Asians | 77.7 /100 | #133 | Good 84.8% |
| Syrians | 76.5 /100 | #134 | Good 84.8% |
| Immigrants | Hungary | 76.4 /100 | #135 | Good 84.8% |
| Bhutanese | 76.0 /100 | #136 | Good 84.8% |
| Immigrants | Canada | 73.5 /100 | #137 | Good 84.8% |
| Armenians | 72.7 /100 | #138 | Good 84.8% |
| Immigrants | Eastern Asia | 72.6 /100 | #139 | Good 84.8% |
| Immigrants | North America | 72.1 /100 | #140 | Good 84.8% |
| Danes | 71.9 /100 | #141 | Good 84.8% |