Bermudan vs Immigrants from Kuwait In Labor Force | Age 25-29
COMPARE
Bermudan
Immigrants from Kuwait
In Labor Force | Age 25-29
In Labor Force | Age 25-29 Comparison
Bermudans
Immigrants from Kuwait
86.0%
IN LABOR FORCE | AGE 25-29
100.0/ 100
METRIC RATING
17th/ 347
METRIC RANK
84.6%
IN LABOR FORCE | AGE 25-29
38.2/ 100
METRIC RATING
184th/ 347
METRIC RANK
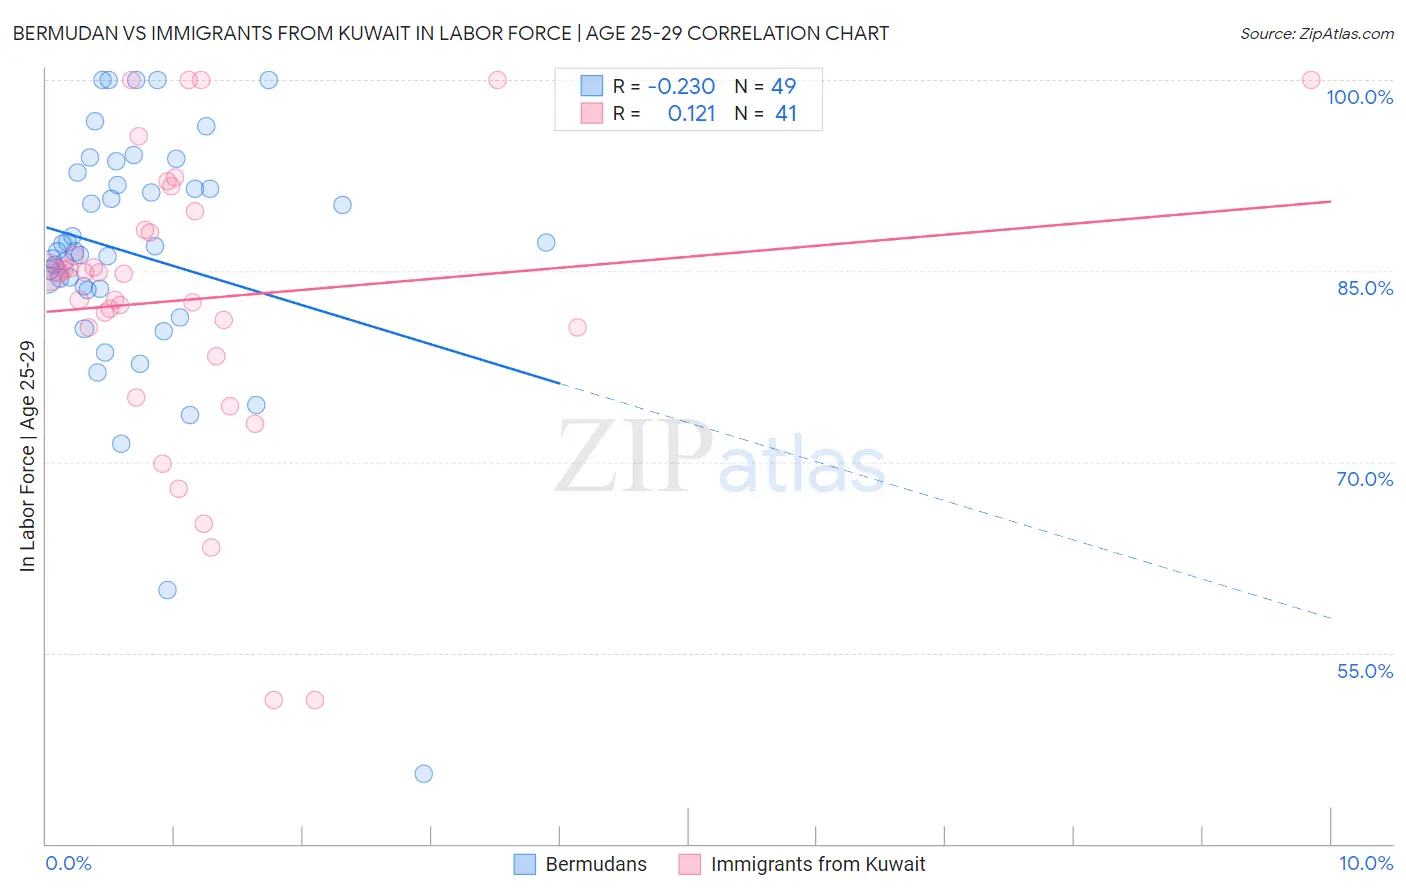
Bermudan vs Immigrants from Kuwait In Labor Force | Age 25-29 Correlation Chart
The statistical analysis conducted on geographies consisting of 55,723,505 people shows a weak negative correlation between the proportion of Bermudans and labor force participation rate among population between the ages 25 and 29 in the United States with a correlation coefficient (R) of -0.230 and weighted average of 86.0%. Similarly, the statistical analysis conducted on geographies consisting of 136,915,125 people shows a poor positive correlation between the proportion of Immigrants from Kuwait and labor force participation rate among population between the ages 25 and 29 in the United States with a correlation coefficient (R) of 0.121 and weighted average of 84.6%, a difference of 1.7%.
In Labor Force | Age 25-29 Correlation Summary
| Measurement | Bermudan | Immigrants from Kuwait |
| Minimum | 45.5% | 51.3% |
| Maximum | 100.0% | 100.0% |
| Range | 54.5% | 48.7% |
| Mean | 86.3% | 82.8% |
| Median | 86.6% | 84.8% |
| Interquartile 25% (IQ1) | 83.5% | 79.5% |
| Interquartile 75% (IQ3) | 92.2% | 89.0% |
| Interquartile Range (IQR) | 8.7% | 9.5% |
| Standard Deviation (Sample) | 10.0% | 11.6% |
| Standard Deviation (Population) | 9.9% | 11.5% |
Similar Demographics by In Labor Force | Age 25-29
Demographics Similar to Bermudans by In Labor Force | Age 25-29
In terms of in labor force | age 25-29, the demographic groups most similar to Bermudans are Bulgarian (86.0%, a difference of 0.030%), Immigrants from Bolivia (86.1%, a difference of 0.040%), Cape Verdean (86.0%, a difference of 0.040%), Latvian (86.1%, a difference of 0.050%), and Bolivian (86.1%, a difference of 0.050%).
| Demographics | Rating | Rank | In Labor Force | Age 25-29 |
| Liberians | 100.0 /100 | #10 | Exceptional 86.1% |
| Immigrants | Ethiopia | 100.0 /100 | #11 | Exceptional 86.1% |
| Immigrants | Lithuania | 100.0 /100 | #12 | Exceptional 86.1% |
| Norwegians | 100.0 /100 | #13 | Exceptional 86.1% |
| Latvians | 100.0 /100 | #14 | Exceptional 86.1% |
| Bolivians | 100.0 /100 | #15 | Exceptional 86.1% |
| Immigrants | Bolivia | 100.0 /100 | #16 | Exceptional 86.1% |
| Bermudans | 100.0 /100 | #17 | Exceptional 86.0% |
| Bulgarians | 100.0 /100 | #18 | Exceptional 86.0% |
| Cape Verdeans | 100.0 /100 | #19 | Exceptional 86.0% |
| Immigrants | Ireland | 100.0 /100 | #20 | Exceptional 86.0% |
| Maltese | 100.0 /100 | #21 | Exceptional 86.0% |
| Cambodians | 100.0 /100 | #22 | Exceptional 86.0% |
| Immigrants | Uganda | 100.0 /100 | #23 | Exceptional 86.0% |
| Immigrants | Eastern Africa | 100.0 /100 | #24 | Exceptional 86.0% |
Demographics Similar to Immigrants from Kuwait by In Labor Force | Age 25-29
In terms of in labor force | age 25-29, the demographic groups most similar to Immigrants from Kuwait are Scottish (84.6%, a difference of 0.010%), Immigrants from Denmark (84.6%, a difference of 0.010%), European (84.6%, a difference of 0.020%), Immigrants from Norway (84.6%, a difference of 0.030%), and Immigrants from Belgium (84.6%, a difference of 0.030%).
| Demographics | Rating | Rank | In Labor Force | Age 25-29 |
| Immigrants | China | 45.7 /100 | #177 | Average 84.6% |
| Immigrants | Thailand | 45.2 /100 | #178 | Average 84.6% |
| Immigrants | Argentina | 44.0 /100 | #179 | Average 84.6% |
| Immigrants | South America | 42.9 /100 | #180 | Average 84.6% |
| Immigrants | Norway | 41.9 /100 | #181 | Average 84.6% |
| Europeans | 40.3 /100 | #182 | Average 84.6% |
| Scottish | 40.1 /100 | #183 | Average 84.6% |
| Immigrants | Kuwait | 38.2 /100 | #184 | Fair 84.6% |
| Immigrants | Denmark | 37.0 /100 | #185 | Fair 84.6% |
| Immigrants | Belgium | 35.0 /100 | #186 | Fair 84.6% |
| Immigrants | Portugal | 34.7 /100 | #187 | Fair 84.6% |
| Immigrants | Ukraine | 33.7 /100 | #188 | Fair 84.5% |
| Moroccans | 32.6 /100 | #189 | Fair 84.5% |
| Welsh | 31.1 /100 | #190 | Fair 84.5% |
| Zimbabweans | 28.7 /100 | #191 | Fair 84.5% |