Bermudan vs Alaskan Athabascan In Labor Force | Age 25-29
COMPARE
Bermudan
Alaskan Athabascan
In Labor Force | Age 25-29
In Labor Force | Age 25-29 Comparison
Bermudans
Alaskan Athabascans
86.0%
IN LABOR FORCE | AGE 25-29
100.0/ 100
METRIC RATING
17th/ 347
METRIC RANK
82.3%
IN LABOR FORCE | AGE 25-29
0.0/ 100
METRIC RATING
311th/ 347
METRIC RANK
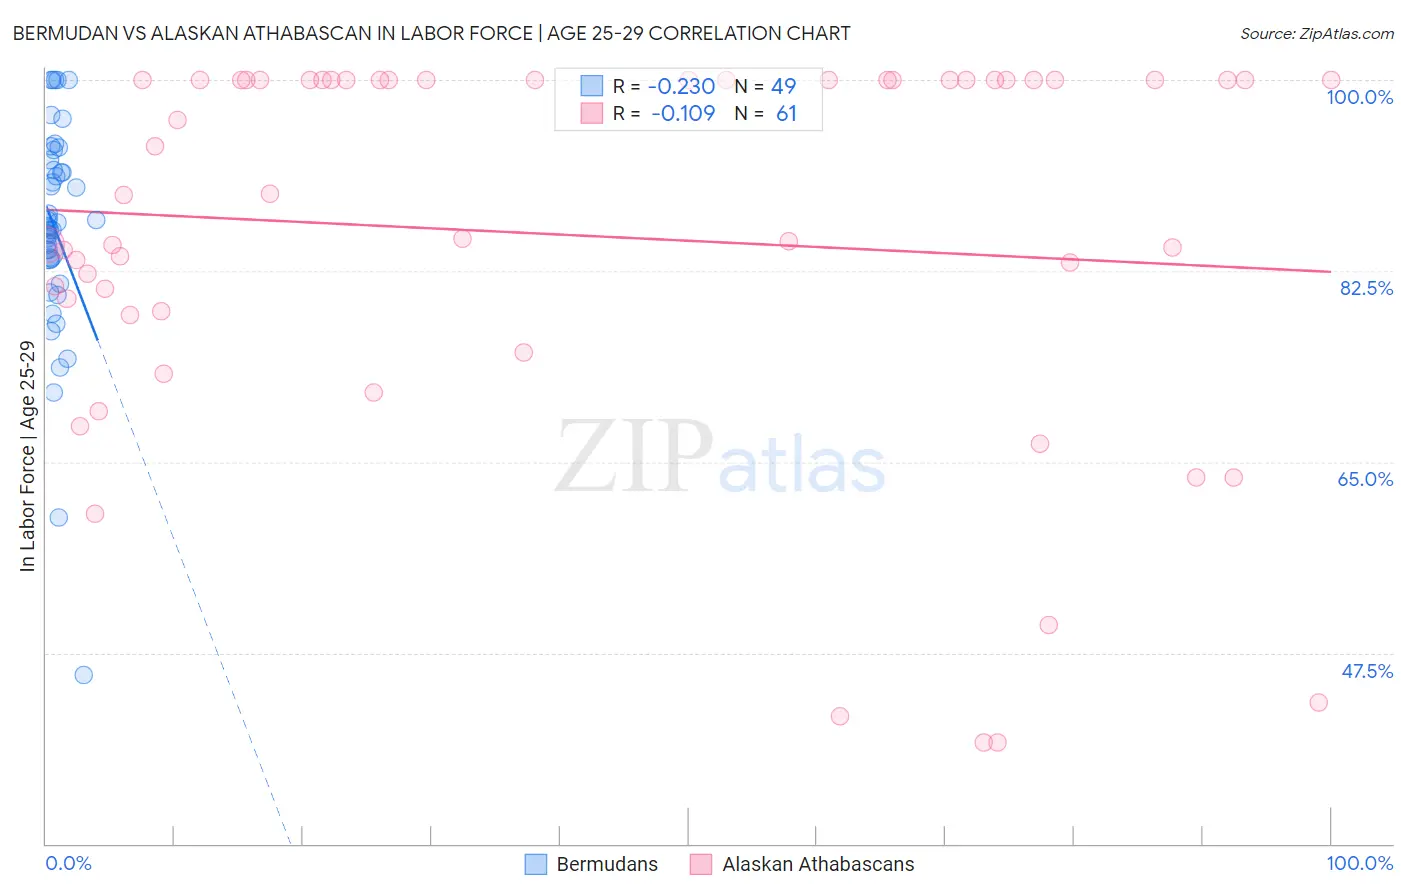
Bermudan vs Alaskan Athabascan In Labor Force | Age 25-29 Correlation Chart
The statistical analysis conducted on geographies consisting of 55,723,505 people shows a weak negative correlation between the proportion of Bermudans and labor force participation rate among population between the ages 25 and 29 in the United States with a correlation coefficient (R) of -0.230 and weighted average of 86.0%. Similarly, the statistical analysis conducted on geographies consisting of 45,810,545 people shows a poor negative correlation between the proportion of Alaskan Athabascans and labor force participation rate among population between the ages 25 and 29 in the United States with a correlation coefficient (R) of -0.109 and weighted average of 82.3%, a difference of 4.6%.
In Labor Force | Age 25-29 Correlation Summary
| Measurement | Bermudan | Alaskan Athabascan |
| Minimum | 45.5% | 39.3% |
| Maximum | 100.0% | 100.0% |
| Range | 54.5% | 60.7% |
| Mean | 86.3% | 85.8% |
| Median | 86.6% | 89.5% |
| Interquartile 25% (IQ1) | 83.5% | 78.6% |
| Interquartile 75% (IQ3) | 92.2% | 100.0% |
| Interquartile Range (IQR) | 8.7% | 21.4% |
| Standard Deviation (Sample) | 10.0% | 17.6% |
| Standard Deviation (Population) | 9.9% | 17.4% |
Similar Demographics by In Labor Force | Age 25-29
Demographics Similar to Bermudans by In Labor Force | Age 25-29
In terms of in labor force | age 25-29, the demographic groups most similar to Bermudans are Bulgarian (86.0%, a difference of 0.030%), Immigrants from Bolivia (86.1%, a difference of 0.040%), Cape Verdean (86.0%, a difference of 0.040%), Latvian (86.1%, a difference of 0.050%), and Bolivian (86.1%, a difference of 0.050%).
| Demographics | Rating | Rank | In Labor Force | Age 25-29 |
| Liberians | 100.0 /100 | #10 | Exceptional 86.1% |
| Immigrants | Ethiopia | 100.0 /100 | #11 | Exceptional 86.1% |
| Immigrants | Lithuania | 100.0 /100 | #12 | Exceptional 86.1% |
| Norwegians | 100.0 /100 | #13 | Exceptional 86.1% |
| Latvians | 100.0 /100 | #14 | Exceptional 86.1% |
| Bolivians | 100.0 /100 | #15 | Exceptional 86.1% |
| Immigrants | Bolivia | 100.0 /100 | #16 | Exceptional 86.1% |
| Bermudans | 100.0 /100 | #17 | Exceptional 86.0% |
| Bulgarians | 100.0 /100 | #18 | Exceptional 86.0% |
| Cape Verdeans | 100.0 /100 | #19 | Exceptional 86.0% |
| Immigrants | Ireland | 100.0 /100 | #20 | Exceptional 86.0% |
| Maltese | 100.0 /100 | #21 | Exceptional 86.0% |
| Cambodians | 100.0 /100 | #22 | Exceptional 86.0% |
| Immigrants | Uganda | 100.0 /100 | #23 | Exceptional 86.0% |
| Immigrants | Eastern Africa | 100.0 /100 | #24 | Exceptional 86.0% |
Demographics Similar to Alaskan Athabascans by In Labor Force | Age 25-29
In terms of in labor force | age 25-29, the demographic groups most similar to Alaskan Athabascans are Osage (82.3%, a difference of 0.010%), Hispanic or Latino (82.2%, a difference of 0.070%), Immigrants from Central America (82.4%, a difference of 0.15%), Central American Indian (82.4%, a difference of 0.16%), and Yaqui (82.2%, a difference of 0.17%).
| Demographics | Rating | Rank | In Labor Force | Age 25-29 |
| Immigrants | St. Vincent and the Grenadines | 0.0 /100 | #304 | Tragic 82.7% |
| Blacks/African Americans | 0.0 /100 | #305 | Tragic 82.6% |
| Blackfeet | 0.0 /100 | #306 | Tragic 82.6% |
| Cajuns | 0.0 /100 | #307 | Tragic 82.5% |
| Central American Indians | 0.0 /100 | #308 | Tragic 82.4% |
| Immigrants | Central America | 0.0 /100 | #309 | Tragic 82.4% |
| Osage | 0.0 /100 | #310 | Tragic 82.3% |
| Alaskan Athabascans | 0.0 /100 | #311 | Tragic 82.3% |
| Hispanics or Latinos | 0.0 /100 | #312 | Tragic 82.2% |
| Yaqui | 0.0 /100 | #313 | Tragic 82.2% |
| Cherokee | 0.0 /100 | #314 | Tragic 82.1% |
| Immigrants | Mexico | 0.0 /100 | #315 | Tragic 82.0% |
| Mexicans | 0.0 /100 | #316 | Tragic 81.9% |
| Chickasaw | 0.0 /100 | #317 | Tragic 81.9% |
| Comanche | 0.0 /100 | #318 | Tragic 81.9% |