Belizean vs Ukrainian Bachelor's Degree
COMPARE
Belizean
Ukrainian
Bachelor's Degree
Bachelor's Degree Comparison
Belizeans
Ukrainians
32.8%
BACHELOR'S DEGREE
0.4/ 100
METRIC RATING
263rd/ 347
METRIC RANK
40.9%
BACHELOR'S DEGREE
96.6/ 100
METRIC RATING
108th/ 347
METRIC RANK
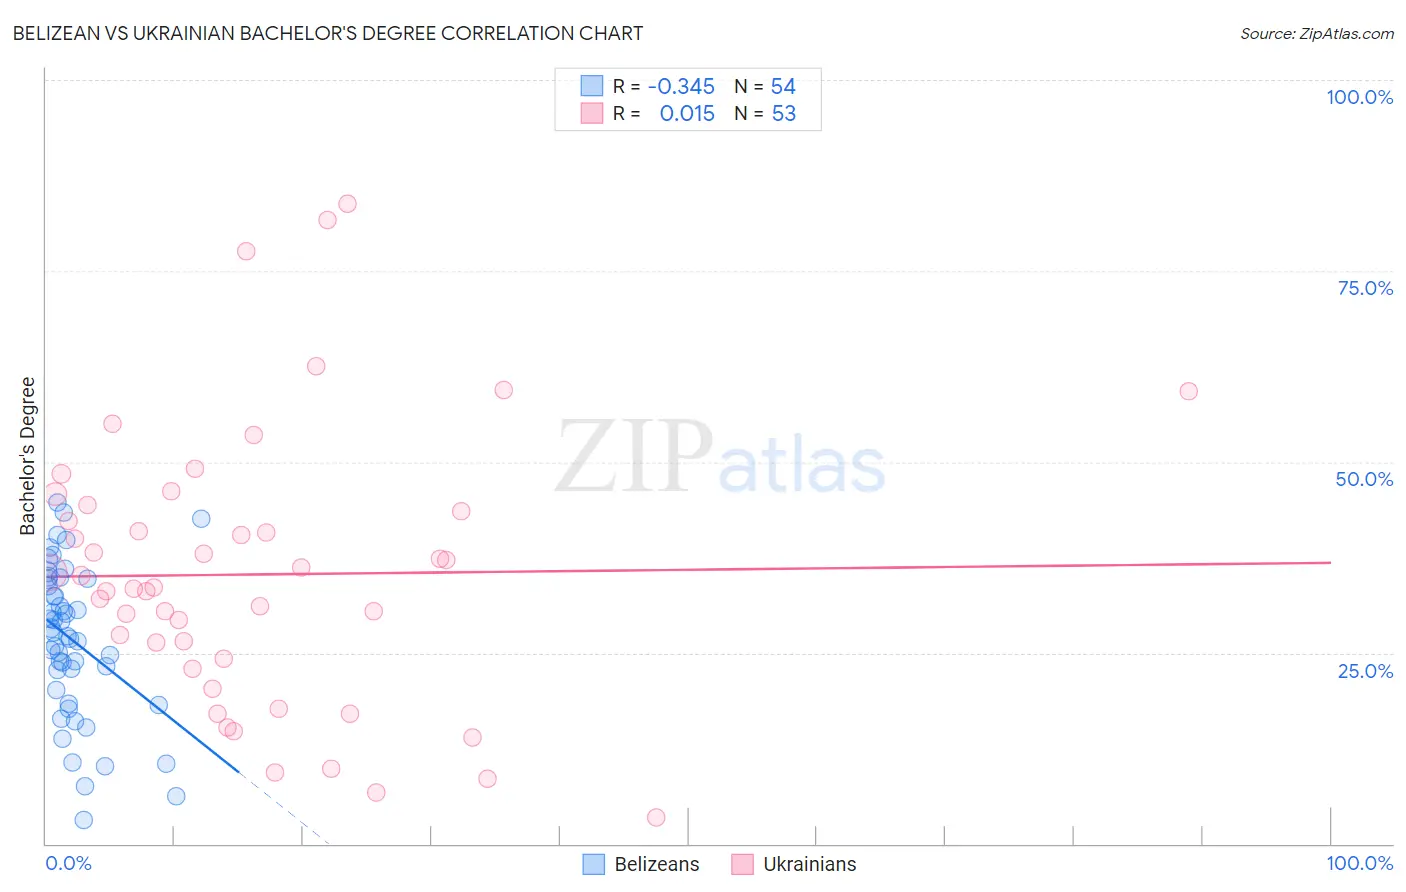
Belizean vs Ukrainian Bachelor's Degree Correlation Chart
The statistical analysis conducted on geographies consisting of 144,217,476 people shows a mild negative correlation between the proportion of Belizeans and percentage of population with at least bachelor's degree education in the United States with a correlation coefficient (R) of -0.345 and weighted average of 32.8%. Similarly, the statistical analysis conducted on geographies consisting of 448,644,466 people shows no correlation between the proportion of Ukrainians and percentage of population with at least bachelor's degree education in the United States with a correlation coefficient (R) of 0.015 and weighted average of 40.9%, a difference of 24.7%.
Bachelor's Degree Correlation Summary
| Measurement | Belizean | Ukrainian |
| Minimum | 3.1% | 3.4% |
| Maximum | 44.8% | 83.8% |
| Range | 41.6% | 80.3% |
| Mean | 26.6% | 35.3% |
| Median | 27.4% | 33.6% |
| Interquartile 25% (IQ1) | 20.1% | 23.6% |
| Interquartile 75% (IQ3) | 34.7% | 43.9% |
| Interquartile Range (IQR) | 14.6% | 20.3% |
| Standard Deviation (Sample) | 10.0% | 18.0% |
| Standard Deviation (Population) | 9.9% | 17.8% |
Similar Demographics by Bachelor's Degree
Demographics Similar to Belizeans by Bachelor's Degree
In terms of bachelor's degree, the demographic groups most similar to Belizeans are African (32.9%, a difference of 0.29%), Immigrants from Jamaica (32.9%, a difference of 0.29%), Malaysian (32.9%, a difference of 0.38%), Osage (33.0%, a difference of 0.75%), and Central American Indian (32.5%, a difference of 0.78%).
| Demographics | Rating | Rank | Bachelor's Degree |
| Nicaraguans | 0.6 /100 | #256 | Tragic 33.1% |
| Spanish Americans | 0.6 /100 | #257 | Tragic 33.1% |
| French American Indians | 0.6 /100 | #258 | Tragic 33.1% |
| Osage | 0.5 /100 | #259 | Tragic 33.0% |
| Malaysians | 0.5 /100 | #260 | Tragic 32.9% |
| Africans | 0.5 /100 | #261 | Tragic 32.9% |
| Immigrants | Jamaica | 0.5 /100 | #262 | Tragic 32.9% |
| Belizeans | 0.4 /100 | #263 | Tragic 32.8% |
| Central American Indians | 0.3 /100 | #264 | Tragic 32.5% |
| Bahamians | 0.3 /100 | #265 | Tragic 32.5% |
| Immigrants | Dominica | 0.3 /100 | #266 | Tragic 32.5% |
| Cubans | 0.3 /100 | #267 | Tragic 32.5% |
| Immigrants | Portugal | 0.2 /100 | #268 | Tragic 32.2% |
| Immigrants | Belize | 0.2 /100 | #269 | Tragic 32.1% |
| Immigrants | Nicaragua | 0.2 /100 | #270 | Tragic 31.9% |
Demographics Similar to Ukrainians by Bachelor's Degree
In terms of bachelor's degree, the demographic groups most similar to Ukrainians are Arab (40.9%, a difference of 0.020%), Albanian (40.9%, a difference of 0.090%), Northern European (41.0%, a difference of 0.14%), Immigrants from Chile (40.8%, a difference of 0.14%), and Ugandan (40.8%, a difference of 0.19%).
| Demographics | Rating | Rank | Bachelor's Degree |
| Immigrants | Morocco | 98.0 /100 | #101 | Exceptional 41.4% |
| Immigrants | Italy | 97.8 /100 | #102 | Exceptional 41.3% |
| Chileans | 97.5 /100 | #103 | Exceptional 41.2% |
| Jordanians | 97.4 /100 | #104 | Exceptional 41.2% |
| Syrians | 97.4 /100 | #105 | Exceptional 41.1% |
| Alsatians | 97.0 /100 | #106 | Exceptional 41.0% |
| Northern Europeans | 96.8 /100 | #107 | Exceptional 41.0% |
| Ukrainians | 96.6 /100 | #108 | Exceptional 40.9% |
| Arabs | 96.6 /100 | #109 | Exceptional 40.9% |
| Albanians | 96.5 /100 | #110 | Exceptional 40.9% |
| Immigrants | Chile | 96.4 /100 | #111 | Exceptional 40.8% |
| Ugandans | 96.3 /100 | #112 | Exceptional 40.8% |
| Brazilians | 96.3 /100 | #113 | Exceptional 40.8% |
| Afghans | 96.2 /100 | #114 | Exceptional 40.8% |
| Palestinians | 95.8 /100 | #115 | Exceptional 40.7% |