Belizean vs Immigrants from Spain In Labor Force | Age 45-54
COMPARE
Belizean
Immigrants from Spain
In Labor Force | Age 45-54
In Labor Force | Age 45-54 Comparison
Belizeans
Immigrants from Spain
80.8%
IN LABOR FORCE | AGE 45-54
0.0/ 100
METRIC RATING
284th/ 347
METRIC RANK
83.0%
IN LABOR FORCE | AGE 45-54
80.4/ 100
METRIC RATING
137th/ 347
METRIC RANK
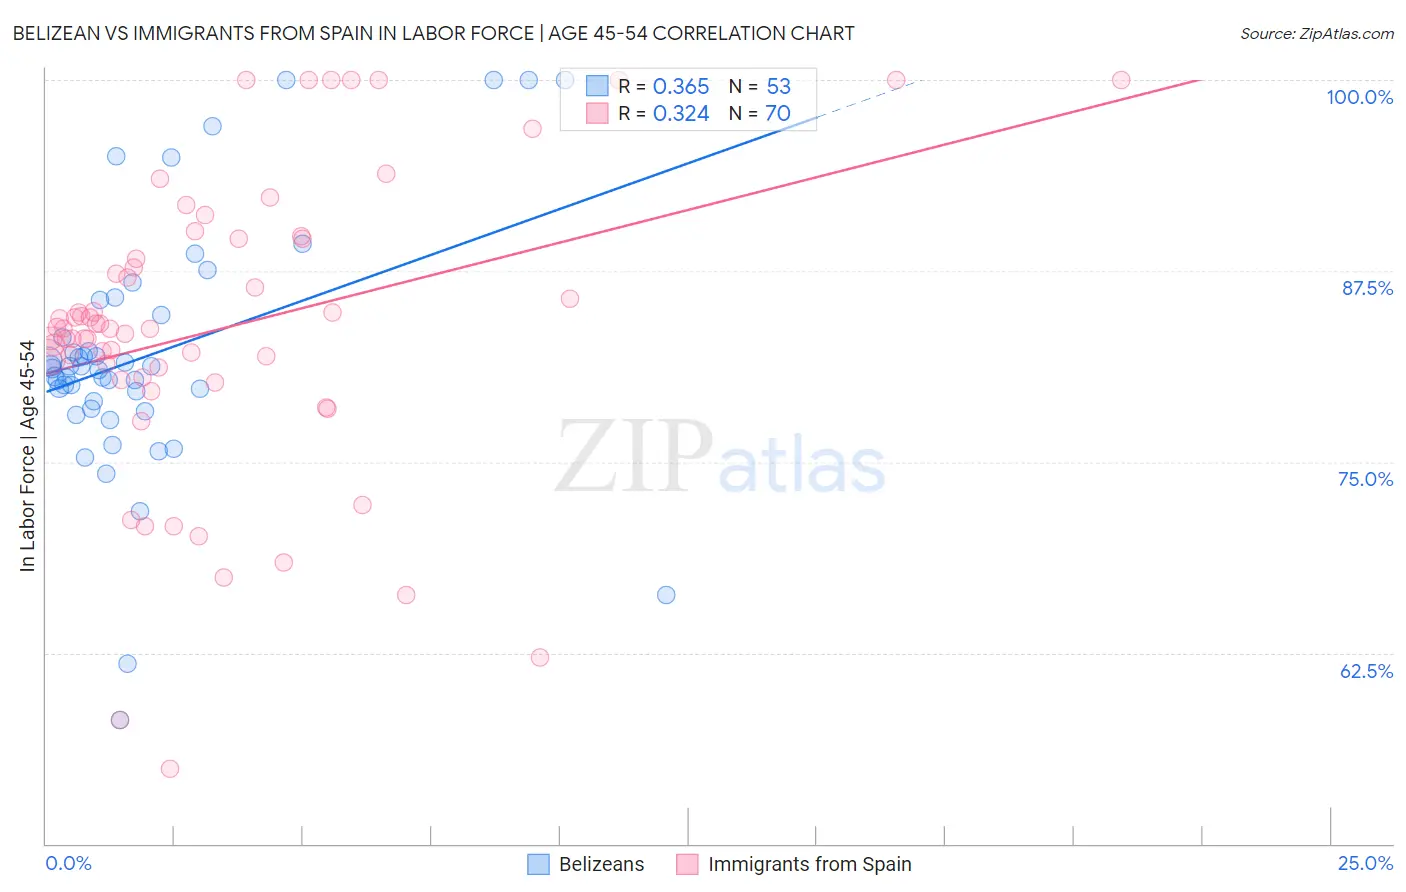
Belizean vs Immigrants from Spain In Labor Force | Age 45-54 Correlation Chart
The statistical analysis conducted on geographies consisting of 144,162,526 people shows a mild positive correlation between the proportion of Belizeans and labor force participation rate among population between the ages 45 and 54 in the United States with a correlation coefficient (R) of 0.365 and weighted average of 80.8%. Similarly, the statistical analysis conducted on geographies consisting of 239,591,563 people shows a mild positive correlation between the proportion of Immigrants from Spain and labor force participation rate among population between the ages 45 and 54 in the United States with a correlation coefficient (R) of 0.324 and weighted average of 83.0%, a difference of 2.8%.
In Labor Force | Age 45-54 Correlation Summary
| Measurement | Belizean | Immigrants from Spain |
| Minimum | 58.1% | 54.9% |
| Maximum | 100.0% | 100.0% |
| Range | 41.9% | 45.1% |
| Mean | 82.0% | 83.7% |
| Median | 81.1% | 83.7% |
| Interquartile 25% (IQ1) | 78.7% | 80.5% |
| Interquartile 75% (IQ3) | 85.1% | 89.6% |
| Interquartile Range (IQR) | 6.4% | 9.1% |
| Standard Deviation (Sample) | 8.4% | 9.8% |
| Standard Deviation (Population) | 8.4% | 9.7% |
Similar Demographics by In Labor Force | Age 45-54
Demographics Similar to Belizeans by In Labor Force | Age 45-54
In terms of in labor force | age 45-54, the demographic groups most similar to Belizeans are Delaware (80.8%, a difference of 0.010%), Immigrants from Dominica (80.8%, a difference of 0.010%), Vietnamese (80.8%, a difference of 0.020%), Cree (80.8%, a difference of 0.020%), and French American Indian (80.8%, a difference of 0.050%).
| Demographics | Rating | Rank | In Labor Force | Age 45-54 |
| Guatemalans | 0.0 /100 | #277 | Tragic 81.2% |
| Immigrants | Guatemala | 0.0 /100 | #278 | Tragic 81.1% |
| Immigrants | Micronesia | 0.0 /100 | #279 | Tragic 81.1% |
| Immigrants | Latin America | 0.0 /100 | #280 | Tragic 81.0% |
| Immigrants | Grenada | 0.0 /100 | #281 | Tragic 81.0% |
| Aleuts | 0.0 /100 | #282 | Tragic 81.0% |
| French American Indians | 0.0 /100 | #283 | Tragic 80.8% |
| Belizeans | 0.0 /100 | #284 | Tragic 80.8% |
| Delaware | 0.0 /100 | #285 | Tragic 80.8% |
| Immigrants | Dominica | 0.0 /100 | #286 | Tragic 80.8% |
| Vietnamese | 0.0 /100 | #287 | Tragic 80.8% |
| Cree | 0.0 /100 | #288 | Tragic 80.8% |
| Immigrants | Bangladesh | 0.0 /100 | #289 | Tragic 80.7% |
| Mexican American Indians | 0.0 /100 | #290 | Tragic 80.7% |
| Immigrants | Belize | 0.0 /100 | #291 | Tragic 80.6% |
Demographics Similar to Immigrants from Spain by In Labor Force | Age 45-54
In terms of in labor force | age 45-54, the demographic groups most similar to Immigrants from Spain are Austrian (83.0%, a difference of 0.010%), Immigrants from Kazakhstan (83.0%, a difference of 0.010%), Ghanaian (83.0%, a difference of 0.010%), Sudanese (83.0%, a difference of 0.020%), and Liberian (83.0%, a difference of 0.030%).
| Demographics | Rating | Rank | In Labor Force | Age 45-54 |
| Immigrants | Israel | 84.7 /100 | #130 | Excellent 83.1% |
| Finns | 83.3 /100 | #131 | Excellent 83.1% |
| Immigrants | Ukraine | 82.9 /100 | #132 | Excellent 83.0% |
| Liberians | 82.7 /100 | #133 | Excellent 83.0% |
| Sudanese | 82.0 /100 | #134 | Excellent 83.0% |
| Austrians | 81.3 /100 | #135 | Excellent 83.0% |
| Immigrants | Kazakhstan | 81.0 /100 | #136 | Excellent 83.0% |
| Immigrants | Spain | 80.4 /100 | #137 | Excellent 83.0% |
| Ghanaians | 79.5 /100 | #138 | Good 83.0% |
| Scandinavians | 78.5 /100 | #139 | Good 83.0% |
| Yugoslavians | 78.3 /100 | #140 | Good 83.0% |
| Immigrants | Haiti | 77.9 /100 | #141 | Good 83.0% |
| Immigrants | Scotland | 77.8 /100 | #142 | Good 83.0% |
| Okinawans | 77.0 /100 | #143 | Good 83.0% |
| Soviet Union | 76.8 /100 | #144 | Good 83.0% |