Basque vs Canadian In Labor Force | Age 30-34
COMPARE
Basque
Canadian
In Labor Force | Age 30-34
In Labor Force | Age 30-34 Comparison
Basques
Canadians
84.0%
IN LABOR FORCE | AGE 30-34
0.9/ 100
METRIC RATING
244th/ 347
METRIC RANK
84.4%
IN LABOR FORCE | AGE 30-34
15.4/ 100
METRIC RATING
203rd/ 347
METRIC RANK
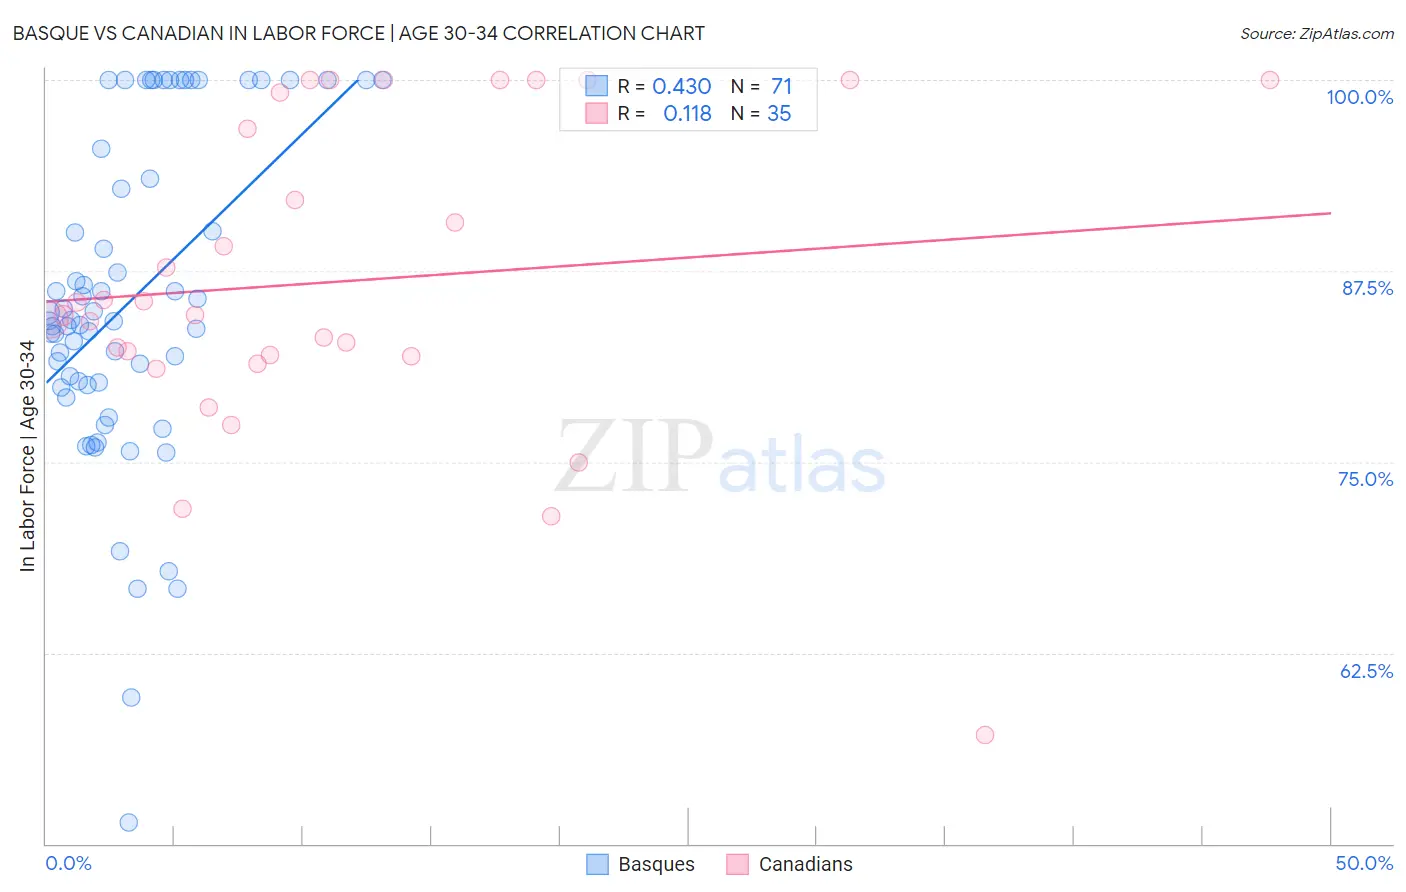
Basque vs Canadian In Labor Force | Age 30-34 Correlation Chart
The statistical analysis conducted on geographies consisting of 165,739,384 people shows a moderate positive correlation between the proportion of Basques and labor force participation rate among population between the ages 30 and 34 in the United States with a correlation coefficient (R) of 0.430 and weighted average of 84.0%. Similarly, the statistical analysis conducted on geographies consisting of 437,189,359 people shows a poor positive correlation between the proportion of Canadians and labor force participation rate among population between the ages 30 and 34 in the United States with a correlation coefficient (R) of 0.118 and weighted average of 84.4%, a difference of 0.53%.
In Labor Force | Age 30-34 Correlation Summary
| Measurement | Basque | Canadian |
| Minimum | 51.4% | 57.1% |
| Maximum | 100.0% | 100.0% |
| Range | 48.6% | 42.9% |
| Mean | 85.6% | 86.8% |
| Median | 84.2% | 84.6% |
| Interquartile 25% (IQ1) | 80.1% | 81.9% |
| Interquartile 75% (IQ3) | 95.5% | 99.2% |
| Interquartile Range (IQR) | 15.4% | 17.3% |
| Standard Deviation (Sample) | 10.7% | 10.2% |
| Standard Deviation (Population) | 10.6% | 10.1% |
Similar Demographics by In Labor Force | Age 30-34
Demographics Similar to Basques by In Labor Force | Age 30-34
In terms of in labor force | age 30-34, the demographic groups most similar to Basques are Immigrants from Venezuela (84.0%, a difference of 0.0%), Central American (84.0%, a difference of 0.0%), British West Indian (84.0%, a difference of 0.020%), Immigrants from Caribbean (84.0%, a difference of 0.030%), and Portuguese (84.0%, a difference of 0.030%).
| Demographics | Rating | Rank | In Labor Force | Age 30-34 |
| Celtics | 1.4 /100 | #237 | Tragic 84.1% |
| Immigrants | Barbados | 1.4 /100 | #238 | Tragic 84.0% |
| English | 1.4 /100 | #239 | Tragic 84.0% |
| Venezuelans | 1.3 /100 | #240 | Tragic 84.0% |
| Immigrants | Portugal | 1.2 /100 | #241 | Tragic 84.0% |
| Immigrants | Oceania | 1.1 /100 | #242 | Tragic 84.0% |
| Immigrants | Caribbean | 1.1 /100 | #243 | Tragic 84.0% |
| Basques | 0.9 /100 | #244 | Tragic 84.0% |
| Immigrants | Venezuela | 0.9 /100 | #245 | Tragic 84.0% |
| Central Americans | 0.9 /100 | #246 | Tragic 84.0% |
| British West Indians | 0.8 /100 | #247 | Tragic 84.0% |
| Portuguese | 0.8 /100 | #248 | Tragic 84.0% |
| Immigrants | Dominica | 0.7 /100 | #249 | Tragic 84.0% |
| Immigrants | Iraq | 0.7 /100 | #250 | Tragic 83.9% |
| Nicaraguans | 0.6 /100 | #251 | Tragic 83.9% |
Demographics Similar to Canadians by In Labor Force | Age 30-34
In terms of in labor force | age 30-34, the demographic groups most similar to Canadians are Ecuadorian (84.4%, a difference of 0.020%), French (84.4%, a difference of 0.020%), Trinidadian and Tobagonian (84.5%, a difference of 0.030%), Immigrants from West Indies (84.5%, a difference of 0.030%), and Subsaharan African (84.5%, a difference of 0.040%).
| Demographics | Rating | Rank | In Labor Force | Age 30-34 |
| British | 22.9 /100 | #196 | Fair 84.5% |
| Immigrants | Syria | 21.9 /100 | #197 | Fair 84.5% |
| Dutch | 20.2 /100 | #198 | Fair 84.5% |
| Immigrants | Thailand | 19.1 /100 | #199 | Poor 84.5% |
| Sub-Saharan Africans | 19.0 /100 | #200 | Poor 84.5% |
| Trinidadians and Tobagonians | 18.2 /100 | #201 | Poor 84.5% |
| Immigrants | West Indies | 18.1 /100 | #202 | Poor 84.5% |
| Canadians | 15.4 /100 | #203 | Poor 84.4% |
| Ecuadorians | 14.2 /100 | #204 | Poor 84.4% |
| French | 13.8 /100 | #205 | Poor 84.4% |
| Lebanese | 10.6 /100 | #206 | Poor 84.4% |
| Bangladeshis | 9.4 /100 | #207 | Tragic 84.3% |
| Arabs | 8.9 /100 | #208 | Tragic 84.3% |
| Jamaicans | 8.8 /100 | #209 | Tragic 84.3% |
| Indonesians | 8.8 /100 | #210 | Tragic 84.3% |