Basque vs Ethiopian In Labor Force | Age 30-34
COMPARE
Basque
Ethiopian
In Labor Force | Age 30-34
In Labor Force | Age 30-34 Comparison
Basques
Ethiopians
84.0%
IN LABOR FORCE | AGE 30-34
0.9/ 100
METRIC RATING
244th/ 347
METRIC RANK
86.6%
IN LABOR FORCE | AGE 30-34
100.0/ 100
METRIC RATING
2nd/ 347
METRIC RANK
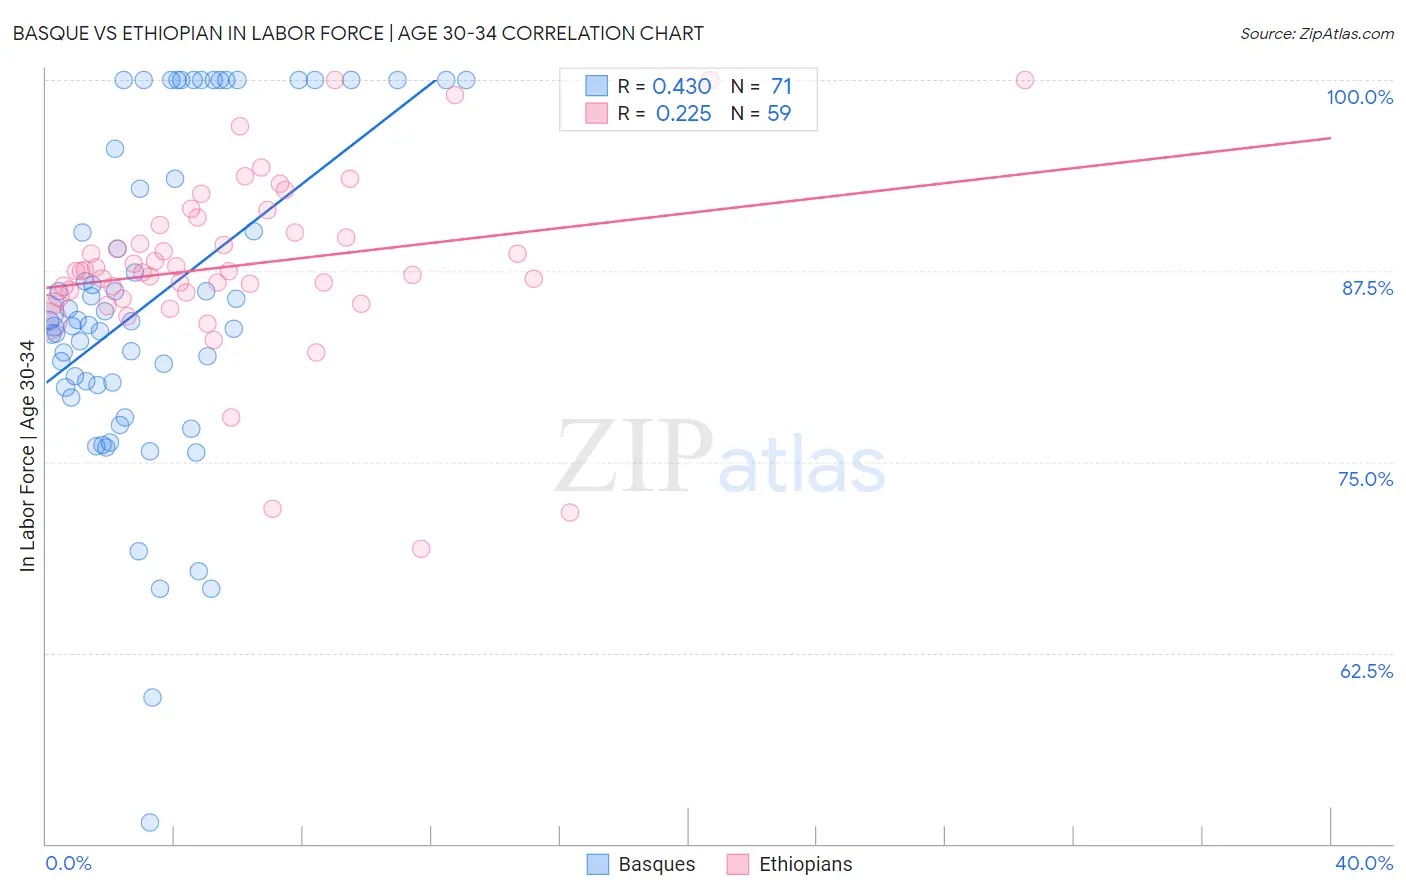
Basque vs Ethiopian In Labor Force | Age 30-34 Correlation Chart
The statistical analysis conducted on geographies consisting of 165,739,384 people shows a moderate positive correlation between the proportion of Basques and labor force participation rate among population between the ages 30 and 34 in the United States with a correlation coefficient (R) of 0.430 and weighted average of 84.0%. Similarly, the statistical analysis conducted on geographies consisting of 223,145,375 people shows a weak positive correlation between the proportion of Ethiopians and labor force participation rate among population between the ages 30 and 34 in the United States with a correlation coefficient (R) of 0.225 and weighted average of 86.6%, a difference of 3.1%.
In Labor Force | Age 30-34 Correlation Summary
| Measurement | Basque | Ethiopian |
| Minimum | 51.4% | 69.3% |
| Maximum | 100.0% | 100.0% |
| Range | 48.6% | 30.7% |
| Mean | 85.6% | 87.9% |
| Median | 84.2% | 87.5% |
| Interquartile 25% (IQ1) | 80.1% | 85.8% |
| Interquartile 75% (IQ3) | 95.5% | 90.5% |
| Interquartile Range (IQR) | 15.4% | 4.7% |
| Standard Deviation (Sample) | 10.7% | 5.9% |
| Standard Deviation (Population) | 10.6% | 5.8% |
Similar Demographics by In Labor Force | Age 30-34
Demographics Similar to Basques by In Labor Force | Age 30-34
In terms of in labor force | age 30-34, the demographic groups most similar to Basques are Immigrants from Venezuela (84.0%, a difference of 0.0%), Central American (84.0%, a difference of 0.0%), British West Indian (84.0%, a difference of 0.020%), Immigrants from Caribbean (84.0%, a difference of 0.030%), and Portuguese (84.0%, a difference of 0.030%).
| Demographics | Rating | Rank | In Labor Force | Age 30-34 |
| Celtics | 1.4 /100 | #237 | Tragic 84.1% |
| Immigrants | Barbados | 1.4 /100 | #238 | Tragic 84.0% |
| English | 1.4 /100 | #239 | Tragic 84.0% |
| Venezuelans | 1.3 /100 | #240 | Tragic 84.0% |
| Immigrants | Portugal | 1.2 /100 | #241 | Tragic 84.0% |
| Immigrants | Oceania | 1.1 /100 | #242 | Tragic 84.0% |
| Immigrants | Caribbean | 1.1 /100 | #243 | Tragic 84.0% |
| Basques | 0.9 /100 | #244 | Tragic 84.0% |
| Immigrants | Venezuela | 0.9 /100 | #245 | Tragic 84.0% |
| Central Americans | 0.9 /100 | #246 | Tragic 84.0% |
| British West Indians | 0.8 /100 | #247 | Tragic 84.0% |
| Portuguese | 0.8 /100 | #248 | Tragic 84.0% |
| Immigrants | Dominica | 0.7 /100 | #249 | Tragic 84.0% |
| Immigrants | Iraq | 0.7 /100 | #250 | Tragic 83.9% |
| Nicaraguans | 0.6 /100 | #251 | Tragic 83.9% |
Demographics Similar to Ethiopians by In Labor Force | Age 30-34
In terms of in labor force | age 30-34, the demographic groups most similar to Ethiopians are Immigrants from Ethiopia (86.6%, a difference of 0.010%), Luxembourger (86.6%, a difference of 0.070%), Liberian (86.4%, a difference of 0.20%), Immigrants from Ireland (86.3%, a difference of 0.35%), and Somali (86.2%, a difference of 0.38%).
| Demographics | Rating | Rank | In Labor Force | Age 30-34 |
| Luxembourgers | 100.0 /100 | #1 | Exceptional 86.6% |
| Ethiopians | 100.0 /100 | #2 | Exceptional 86.6% |
| Immigrants | Ethiopia | 100.0 /100 | #3 | Exceptional 86.6% |
| Liberians | 100.0 /100 | #4 | Exceptional 86.4% |
| Immigrants | Ireland | 100.0 /100 | #5 | Exceptional 86.3% |
| Somalis | 100.0 /100 | #6 | Exceptional 86.2% |
| Immigrants | Bolivia | 100.0 /100 | #7 | Exceptional 86.2% |
| Cambodians | 100.0 /100 | #8 | Exceptional 86.2% |
| Immigrants | Somalia | 100.0 /100 | #9 | Exceptional 86.2% |
| Immigrants | Serbia | 100.0 /100 | #10 | Exceptional 86.2% |
| Carpatho Rusyns | 100.0 /100 | #11 | Exceptional 86.2% |
| Bolivians | 100.0 /100 | #12 | Exceptional 86.1% |
| Immigrants | Croatia | 100.0 /100 | #13 | Exceptional 86.1% |
| Immigrants | Cabo Verde | 100.0 /100 | #14 | Exceptional 86.1% |
| Immigrants | Albania | 100.0 /100 | #15 | Exceptional 86.1% |