Assyrian/Chaldean/Syriac vs Immigrants from the Azores In Labor Force | Age 30-34
COMPARE
Assyrian/Chaldean/Syriac
Immigrants from the Azores
In Labor Force | Age 30-34
In Labor Force | Age 30-34 Comparison
Assyrians/Chaldeans/Syriacs
Immigrants from the Azores
83.2%
IN LABOR FORCE | AGE 30-34
0.0/ 100
METRIC RATING
283rd/ 347
METRIC RANK
81.5%
IN LABOR FORCE | AGE 30-34
0.0/ 100
METRIC RATING
316th/ 347
METRIC RANK
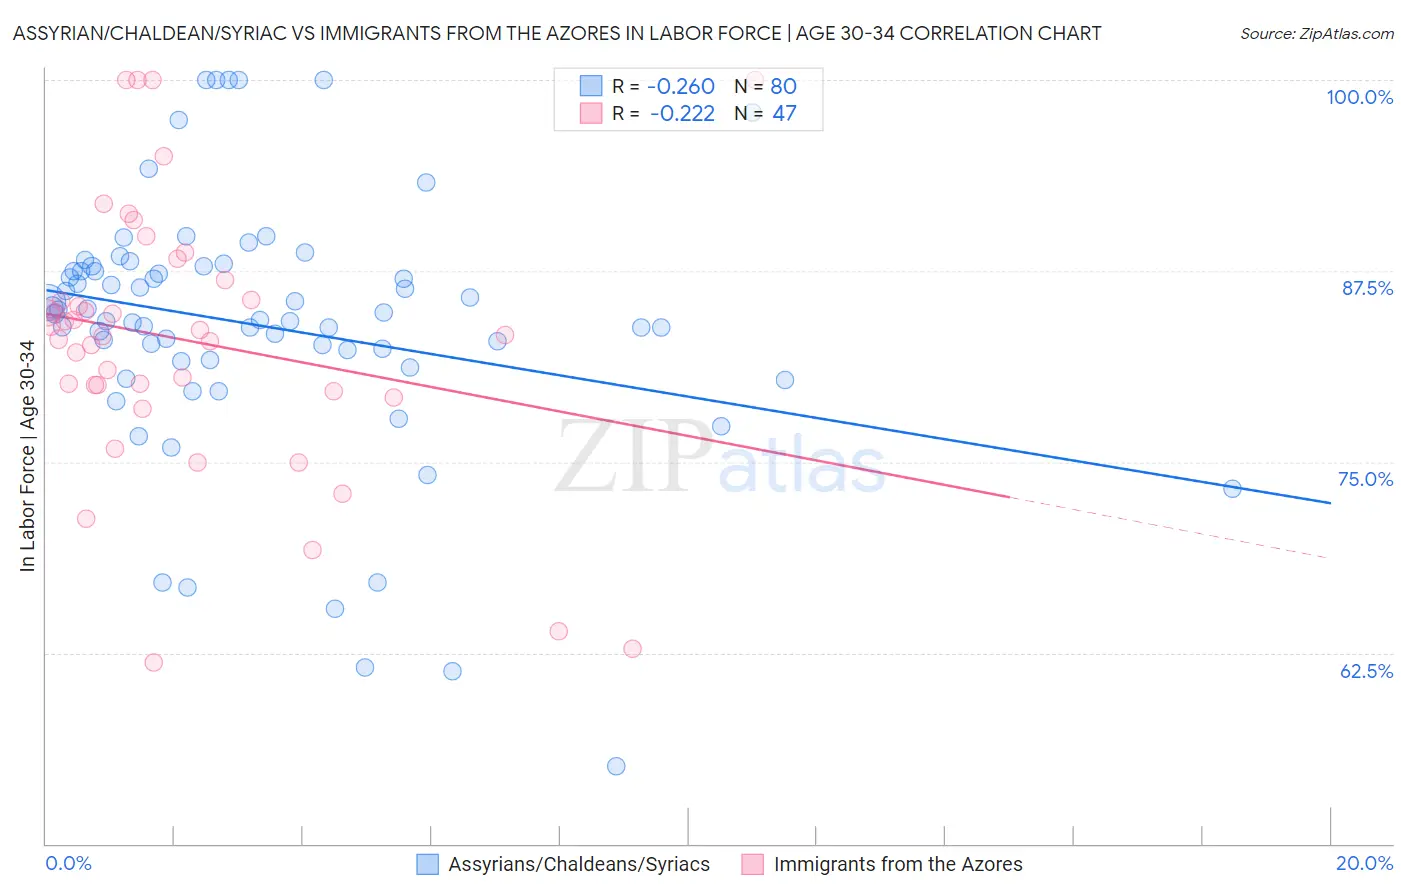
Assyrian/Chaldean/Syriac vs Immigrants from the Azores In Labor Force | Age 30-34 Correlation Chart
The statistical analysis conducted on geographies consisting of 110,308,320 people shows a weak negative correlation between the proportion of Assyrians/Chaldeans/Syriacs and labor force participation rate among population between the ages 30 and 34 in the United States with a correlation coefficient (R) of -0.260 and weighted average of 83.2%. Similarly, the statistical analysis conducted on geographies consisting of 46,256,485 people shows a weak negative correlation between the proportion of Immigrants from the Azores and labor force participation rate among population between the ages 30 and 34 in the United States with a correlation coefficient (R) of -0.222 and weighted average of 81.5%, a difference of 2.1%.
In Labor Force | Age 30-34 Correlation Summary
| Measurement | Assyrian/Chaldean/Syriac | Immigrants from the Azores |
| Minimum | 55.1% | 61.9% |
| Maximum | 100.0% | 100.0% |
| Range | 44.9% | 38.1% |
| Mean | 83.9% | 82.9% |
| Median | 84.5% | 83.3% |
| Interquartile 25% (IQ1) | 81.7% | 79.6% |
| Interquartile 75% (IQ3) | 87.7% | 86.9% |
| Interquartile Range (IQR) | 6.0% | 7.3% |
| Standard Deviation (Sample) | 8.6% | 8.8% |
| Standard Deviation (Population) | 8.5% | 8.7% |
Similar Demographics by In Labor Force | Age 30-34
Demographics Similar to Assyrians/Chaldeans/Syriacs by In Labor Force | Age 30-34
In terms of in labor force | age 30-34, the demographic groups most similar to Assyrians/Chaldeans/Syriacs are Mexican American Indian (83.2%, a difference of 0.010%), Samoan (83.3%, a difference of 0.050%), Immigrants from Belize (83.2%, a difference of 0.050%), Cree (83.2%, a difference of 0.050%), and Immigrants from Latin America (83.1%, a difference of 0.11%).
| Demographics | Rating | Rank | In Labor Force | Age 30-34 |
| Tongans | 0.0 /100 | #276 | Tragic 83.5% |
| Delaware | 0.0 /100 | #277 | Tragic 83.5% |
| Fijians | 0.0 /100 | #278 | Tragic 83.4% |
| Immigrants | Fiji | 0.0 /100 | #279 | Tragic 83.4% |
| Africans | 0.0 /100 | #280 | Tragic 83.4% |
| Samoans | 0.0 /100 | #281 | Tragic 83.3% |
| Mexican American Indians | 0.0 /100 | #282 | Tragic 83.2% |
| Assyrians/Chaldeans/Syriacs | 0.0 /100 | #283 | Tragic 83.2% |
| Immigrants | Belize | 0.0 /100 | #284 | Tragic 83.2% |
| Cree | 0.0 /100 | #285 | Tragic 83.2% |
| Immigrants | Latin America | 0.0 /100 | #286 | Tragic 83.1% |
| Native Hawaiians | 0.0 /100 | #287 | Tragic 83.0% |
| Central American Indians | 0.0 /100 | #288 | Tragic 83.0% |
| Hawaiians | 0.0 /100 | #289 | Tragic 83.0% |
| Blackfeet | 0.0 /100 | #290 | Tragic 82.8% |
Demographics Similar to Immigrants from the Azores by In Labor Force | Age 30-34
In terms of in labor force | age 30-34, the demographic groups most similar to Immigrants from the Azores are Arapaho (81.5%, a difference of 0.010%), Choctaw (81.4%, a difference of 0.080%), Shoshone (81.4%, a difference of 0.090%), Yaqui (81.4%, a difference of 0.10%), and Cherokee (81.6%, a difference of 0.15%).
| Demographics | Rating | Rank | In Labor Force | Age 30-34 |
| Immigrants | Mexico | 0.0 /100 | #309 | Tragic 82.0% |
| Cajuns | 0.0 /100 | #310 | Tragic 82.0% |
| Chickasaw | 0.0 /100 | #311 | Tragic 81.9% |
| Mexicans | 0.0 /100 | #312 | Tragic 81.9% |
| Iroquois | 0.0 /100 | #313 | Tragic 81.9% |
| Alaskan Athabascans | 0.0 /100 | #314 | Tragic 81.7% |
| Cherokee | 0.0 /100 | #315 | Tragic 81.6% |
| Immigrants | Azores | 0.0 /100 | #316 | Tragic 81.5% |
| Arapaho | 0.0 /100 | #317 | Tragic 81.5% |
| Choctaw | 0.0 /100 | #318 | Tragic 81.4% |
| Shoshone | 0.0 /100 | #319 | Tragic 81.4% |
| Yaqui | 0.0 /100 | #320 | Tragic 81.4% |
| Alaska Natives | 0.0 /100 | #321 | Tragic 81.3% |
| Puerto Ricans | 0.0 /100 | #322 | Tragic 81.2% |
| Paiute | 0.0 /100 | #323 | Tragic 81.2% |