Costa Rican vs Immigrants from the Azores In Labor Force | Age 30-34
COMPARE
Costa Rican
Immigrants from the Azores
In Labor Force | Age 30-34
In Labor Force | Age 30-34 Comparison
Costa Ricans
Immigrants from the Azores
84.6%
IN LABOR FORCE | AGE 30-34
29.6/ 100
METRIC RATING
187th/ 347
METRIC RANK
81.5%
IN LABOR FORCE | AGE 30-34
0.0/ 100
METRIC RATING
316th/ 347
METRIC RANK
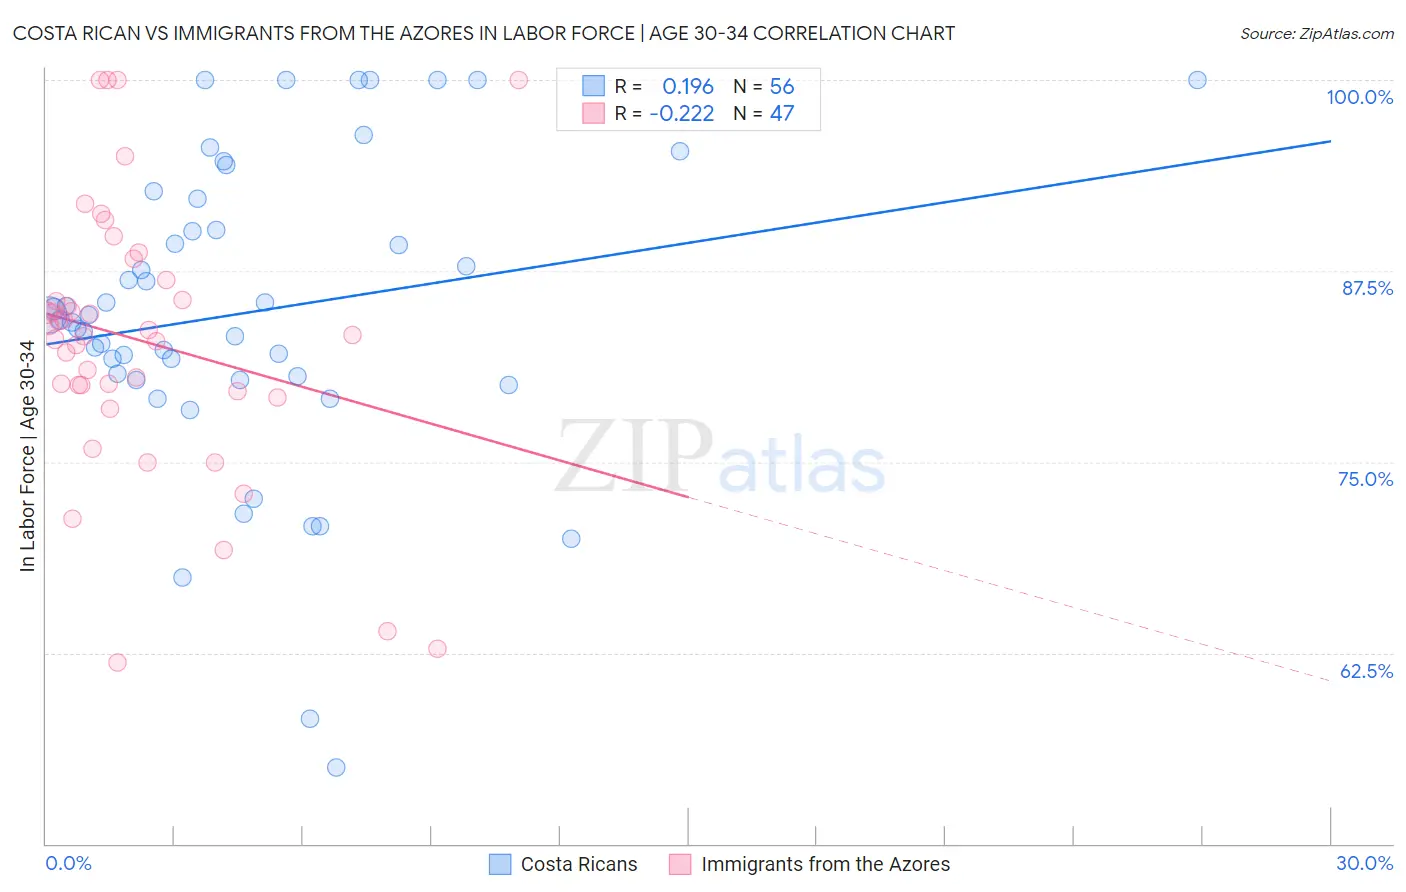
Costa Rican vs Immigrants from the Azores In Labor Force | Age 30-34 Correlation Chart
The statistical analysis conducted on geographies consisting of 253,513,435 people shows a poor positive correlation between the proportion of Costa Ricans and labor force participation rate among population between the ages 30 and 34 in the United States with a correlation coefficient (R) of 0.196 and weighted average of 84.6%. Similarly, the statistical analysis conducted on geographies consisting of 46,256,485 people shows a weak negative correlation between the proportion of Immigrants from the Azores and labor force participation rate among population between the ages 30 and 34 in the United States with a correlation coefficient (R) of -0.222 and weighted average of 81.5%, a difference of 3.8%.
In Labor Force | Age 30-34 Correlation Summary
| Measurement | Costa Rican | Immigrants from the Azores |
| Minimum | 55.0% | 61.9% |
| Maximum | 100.0% | 100.0% |
| Range | 45.0% | 38.1% |
| Mean | 84.8% | 82.9% |
| Median | 84.4% | 83.3% |
| Interquartile 25% (IQ1) | 80.5% | 79.6% |
| Interquartile 75% (IQ3) | 91.2% | 86.9% |
| Interquartile Range (IQR) | 10.7% | 7.3% |
| Standard Deviation (Sample) | 10.0% | 8.8% |
| Standard Deviation (Population) | 9.9% | 8.7% |
Similar Demographics by In Labor Force | Age 30-34
Demographics Similar to Costa Ricans by In Labor Force | Age 30-34
In terms of in labor force | age 30-34, the demographic groups most similar to Costa Ricans are Immigrants from Congo (84.6%, a difference of 0.0%), Taiwanese (84.6%, a difference of 0.0%), Nigerian (84.5%, a difference of 0.010%), Immigrants from Philippines (84.6%, a difference of 0.020%), and Immigrants from North America (84.6%, a difference of 0.030%).
| Demographics | Rating | Rank | In Labor Force | Age 30-34 |
| Immigrants | Netherlands | 42.1 /100 | #180 | Average 84.6% |
| Moroccans | 40.3 /100 | #181 | Average 84.6% |
| Barbadians | 36.7 /100 | #182 | Fair 84.6% |
| Immigrants | Canada | 35.0 /100 | #183 | Fair 84.6% |
| Immigrants | North America | 33.3 /100 | #184 | Fair 84.6% |
| Immigrants | Philippines | 31.5 /100 | #185 | Fair 84.6% |
| Immigrants | Congo | 29.7 /100 | #186 | Fair 84.6% |
| Costa Ricans | 29.6 /100 | #187 | Fair 84.6% |
| Taiwanese | 29.4 /100 | #188 | Fair 84.6% |
| Nigerians | 28.9 /100 | #189 | Fair 84.5% |
| Immigrants | Zaire | 25.8 /100 | #190 | Fair 84.5% |
| Hungarians | 24.8 /100 | #191 | Fair 84.5% |
| Scandinavians | 24.7 /100 | #192 | Fair 84.5% |
| Immigrants | Costa Rica | 23.9 /100 | #193 | Fair 84.5% |
| Immigrants | Afghanistan | 23.5 /100 | #194 | Fair 84.5% |
Demographics Similar to Immigrants from the Azores by In Labor Force | Age 30-34
In terms of in labor force | age 30-34, the demographic groups most similar to Immigrants from the Azores are Arapaho (81.5%, a difference of 0.010%), Choctaw (81.4%, a difference of 0.080%), Shoshone (81.4%, a difference of 0.090%), Yaqui (81.4%, a difference of 0.10%), and Cherokee (81.6%, a difference of 0.15%).
| Demographics | Rating | Rank | In Labor Force | Age 30-34 |
| Immigrants | Mexico | 0.0 /100 | #309 | Tragic 82.0% |
| Cajuns | 0.0 /100 | #310 | Tragic 82.0% |
| Chickasaw | 0.0 /100 | #311 | Tragic 81.9% |
| Mexicans | 0.0 /100 | #312 | Tragic 81.9% |
| Iroquois | 0.0 /100 | #313 | Tragic 81.9% |
| Alaskan Athabascans | 0.0 /100 | #314 | Tragic 81.7% |
| Cherokee | 0.0 /100 | #315 | Tragic 81.6% |
| Immigrants | Azores | 0.0 /100 | #316 | Tragic 81.5% |
| Arapaho | 0.0 /100 | #317 | Tragic 81.5% |
| Choctaw | 0.0 /100 | #318 | Tragic 81.4% |
| Shoshone | 0.0 /100 | #319 | Tragic 81.4% |
| Yaqui | 0.0 /100 | #320 | Tragic 81.4% |
| Alaska Natives | 0.0 /100 | #321 | Tragic 81.3% |
| Puerto Ricans | 0.0 /100 | #322 | Tragic 81.2% |
| Paiute | 0.0 /100 | #323 | Tragic 81.2% |