Immigrants from Oceania vs Immigrants from the Azores In Labor Force | Age 30-34
COMPARE
Immigrants from Oceania
Immigrants from the Azores
In Labor Force | Age 30-34
In Labor Force | Age 30-34 Comparison
Immigrants from Oceania
Immigrants from the Azores
84.0%
IN LABOR FORCE | AGE 30-34
1.1/ 100
METRIC RATING
242nd/ 347
METRIC RANK
81.5%
IN LABOR FORCE | AGE 30-34
0.0/ 100
METRIC RATING
316th/ 347
METRIC RANK
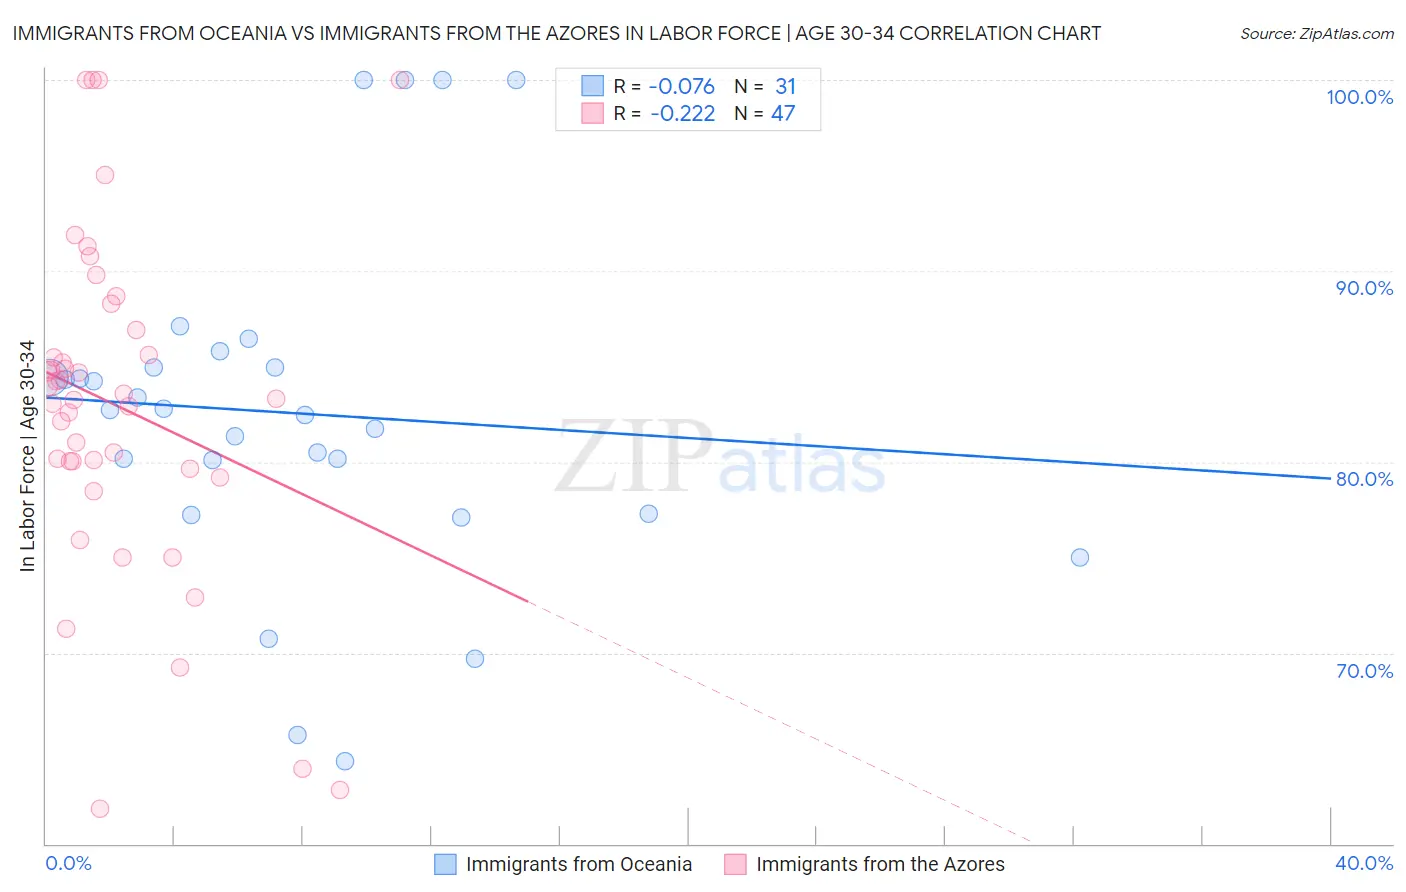
Immigrants from Oceania vs Immigrants from the Azores In Labor Force | Age 30-34 Correlation Chart
The statistical analysis conducted on geographies consisting of 305,403,957 people shows a slight negative correlation between the proportion of Immigrants from Oceania and labor force participation rate among population between the ages 30 and 34 in the United States with a correlation coefficient (R) of -0.076 and weighted average of 84.0%. Similarly, the statistical analysis conducted on geographies consisting of 46,256,485 people shows a weak negative correlation between the proportion of Immigrants from the Azores and labor force participation rate among population between the ages 30 and 34 in the United States with a correlation coefficient (R) of -0.222 and weighted average of 81.5%, a difference of 3.1%.
In Labor Force | Age 30-34 Correlation Summary
| Measurement | Immigrants from Oceania | Immigrants from the Azores |
| Minimum | 64.3% | 61.9% |
| Maximum | 100.0% | 100.0% |
| Range | 35.7% | 38.1% |
| Mean | 82.5% | 82.9% |
| Median | 82.7% | 83.3% |
| Interquartile 25% (IQ1) | 77.3% | 79.6% |
| Interquartile 75% (IQ3) | 84.9% | 86.9% |
| Interquartile Range (IQR) | 7.6% | 7.3% |
| Standard Deviation (Sample) | 8.9% | 8.8% |
| Standard Deviation (Population) | 8.8% | 8.7% |
Similar Demographics by In Labor Force | Age 30-34
Demographics Similar to Immigrants from Oceania by In Labor Force | Age 30-34
In terms of in labor force | age 30-34, the demographic groups most similar to Immigrants from Oceania are Immigrants from Portugal (84.0%, a difference of 0.010%), Immigrants from Caribbean (84.0%, a difference of 0.010%), English (84.0%, a difference of 0.030%), Venezuelan (84.0%, a difference of 0.030%), and Celtic (84.1%, a difference of 0.040%).
| Demographics | Rating | Rank | In Labor Force | Age 30-34 |
| French American Indians | 1.7 /100 | #235 | Tragic 84.1% |
| U.S. Virgin Islanders | 1.5 /100 | #236 | Tragic 84.1% |
| Celtics | 1.4 /100 | #237 | Tragic 84.1% |
| Immigrants | Barbados | 1.4 /100 | #238 | Tragic 84.0% |
| English | 1.4 /100 | #239 | Tragic 84.0% |
| Venezuelans | 1.3 /100 | #240 | Tragic 84.0% |
| Immigrants | Portugal | 1.2 /100 | #241 | Tragic 84.0% |
| Immigrants | Oceania | 1.1 /100 | #242 | Tragic 84.0% |
| Immigrants | Caribbean | 1.1 /100 | #243 | Tragic 84.0% |
| Basques | 0.9 /100 | #244 | Tragic 84.0% |
| Immigrants | Venezuela | 0.9 /100 | #245 | Tragic 84.0% |
| Central Americans | 0.9 /100 | #246 | Tragic 84.0% |
| British West Indians | 0.8 /100 | #247 | Tragic 84.0% |
| Portuguese | 0.8 /100 | #248 | Tragic 84.0% |
| Immigrants | Dominica | 0.7 /100 | #249 | Tragic 84.0% |
Demographics Similar to Immigrants from the Azores by In Labor Force | Age 30-34
In terms of in labor force | age 30-34, the demographic groups most similar to Immigrants from the Azores are Arapaho (81.5%, a difference of 0.010%), Choctaw (81.4%, a difference of 0.080%), Shoshone (81.4%, a difference of 0.090%), Yaqui (81.4%, a difference of 0.10%), and Cherokee (81.6%, a difference of 0.15%).
| Demographics | Rating | Rank | In Labor Force | Age 30-34 |
| Immigrants | Mexico | 0.0 /100 | #309 | Tragic 82.0% |
| Cajuns | 0.0 /100 | #310 | Tragic 82.0% |
| Chickasaw | 0.0 /100 | #311 | Tragic 81.9% |
| Mexicans | 0.0 /100 | #312 | Tragic 81.9% |
| Iroquois | 0.0 /100 | #313 | Tragic 81.9% |
| Alaskan Athabascans | 0.0 /100 | #314 | Tragic 81.7% |
| Cherokee | 0.0 /100 | #315 | Tragic 81.6% |
| Immigrants | Azores | 0.0 /100 | #316 | Tragic 81.5% |
| Arapaho | 0.0 /100 | #317 | Tragic 81.5% |
| Choctaw | 0.0 /100 | #318 | Tragic 81.4% |
| Shoshone | 0.0 /100 | #319 | Tragic 81.4% |
| Yaqui | 0.0 /100 | #320 | Tragic 81.4% |
| Alaska Natives | 0.0 /100 | #321 | Tragic 81.3% |
| Puerto Ricans | 0.0 /100 | #322 | Tragic 81.2% |
| Paiute | 0.0 /100 | #323 | Tragic 81.2% |