Barbadian vs Ottawa In Labor Force | Age 20-64
COMPARE
Barbadian
Ottawa
In Labor Force | Age 20-64
In Labor Force | Age 20-64 Comparison
Barbadians
Ottawa
78.8%
IN LABOR FORCE | AGE 20-64
0.7/ 100
METRIC RATING
251st/ 347
METRIC RANK
76.7%
IN LABOR FORCE | AGE 20-64
0.0/ 100
METRIC RATING
315th/ 347
METRIC RANK
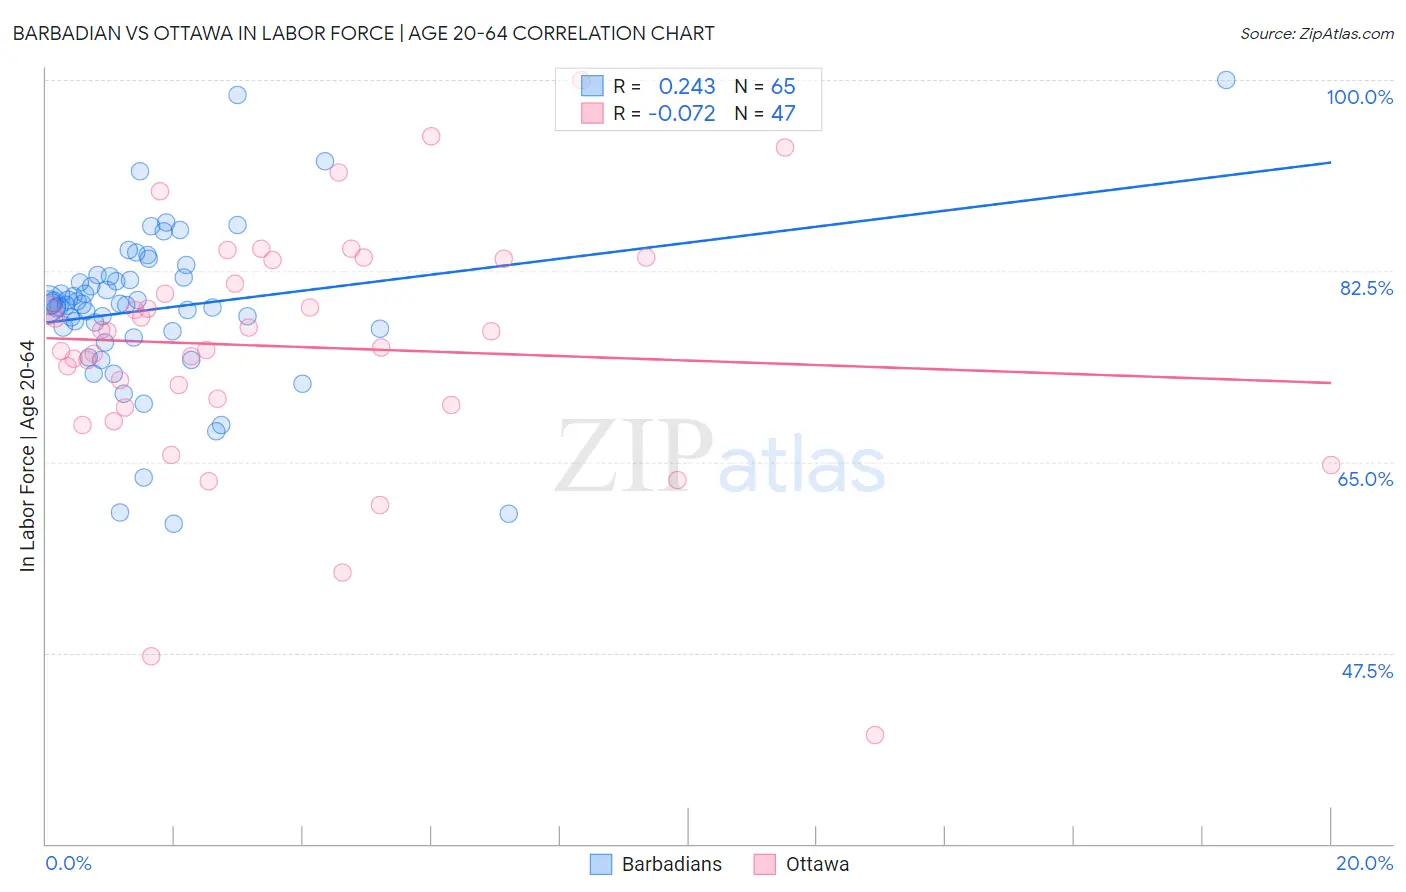
Barbadian vs Ottawa In Labor Force | Age 20-64 Correlation Chart
The statistical analysis conducted on geographies consisting of 141,304,311 people shows a weak positive correlation between the proportion of Barbadians and labor force participation rate among population between the ages 20 and 64 in the United States with a correlation coefficient (R) of 0.243 and weighted average of 78.8%. Similarly, the statistical analysis conducted on geographies consisting of 49,955,365 people shows a slight negative correlation between the proportion of Ottawa and labor force participation rate among population between the ages 20 and 64 in the United States with a correlation coefficient (R) of -0.072 and weighted average of 76.7%, a difference of 2.7%.
In Labor Force | Age 20-64 Correlation Summary
| Measurement | Barbadian | Ottawa |
| Minimum | 59.3% | 40.0% |
| Maximum | 100.0% | 100.0% |
| Range | 40.7% | 60.0% |
| Mean | 79.0% | 75.6% |
| Median | 79.4% | 77.0% |
| Interquartile 25% (IQ1) | 76.7% | 70.2% |
| Interquartile 75% (IQ3) | 81.9% | 83.5% |
| Interquartile Range (IQR) | 5.2% | 13.3% |
| Standard Deviation (Sample) | 7.4% | 11.3% |
| Standard Deviation (Population) | 7.4% | 11.1% |
Similar Demographics by In Labor Force | Age 20-64
Demographics Similar to Barbadians by In Labor Force | Age 20-64
In terms of in labor force | age 20-64, the demographic groups most similar to Barbadians are English (78.8%, a difference of 0.030%), Honduran (78.8%, a difference of 0.030%), Immigrants from Honduras (78.7%, a difference of 0.050%), Immigrants from Germany (78.8%, a difference of 0.060%), and Immigrants from Caribbean (78.8%, a difference of 0.060%).
| Demographics | Rating | Rank | In Labor Force | Age 20-64 |
| French | 1.5 /100 | #244 | Tragic 78.9% |
| Scottish | 1.3 /100 | #245 | Tragic 78.9% |
| Immigrants | Trinidad and Tobago | 1.1 /100 | #246 | Tragic 78.8% |
| Immigrants | Germany | 1.0 /100 | #247 | Tragic 78.8% |
| Immigrants | Caribbean | 1.0 /100 | #248 | Tragic 78.8% |
| English | 0.9 /100 | #249 | Tragic 78.8% |
| Hondurans | 0.8 /100 | #250 | Tragic 78.8% |
| Barbadians | 0.7 /100 | #251 | Tragic 78.8% |
| Immigrants | Honduras | 0.6 /100 | #252 | Tragic 78.7% |
| Basques | 0.5 /100 | #253 | Tragic 78.7% |
| Immigrants | Lebanon | 0.5 /100 | #254 | Tragic 78.7% |
| Hawaiians | 0.5 /100 | #255 | Tragic 78.7% |
| Celtics | 0.5 /100 | #256 | Tragic 78.7% |
| Guatemalans | 0.4 /100 | #257 | Tragic 78.7% |
| Immigrants | Guatemala | 0.4 /100 | #258 | Tragic 78.7% |
Demographics Similar to Ottawa by In Labor Force | Age 20-64
In terms of in labor force | age 20-64, the demographic groups most similar to Ottawa are Black/African American (76.8%, a difference of 0.10%), Shoshone (76.8%, a difference of 0.12%), Yaqui (76.5%, a difference of 0.19%), Alaskan Athabascan (76.9%, a difference of 0.24%), and Blackfeet (77.0%, a difference of 0.41%).
| Demographics | Rating | Rank | In Labor Force | Age 20-64 |
| Alaska Natives | 0.0 /100 | #308 | Tragic 77.0% |
| Americans | 0.0 /100 | #309 | Tragic 77.0% |
| Comanche | 0.0 /100 | #310 | Tragic 77.0% |
| Blackfeet | 0.0 /100 | #311 | Tragic 77.0% |
| Alaskan Athabascans | 0.0 /100 | #312 | Tragic 76.9% |
| Shoshone | 0.0 /100 | #313 | Tragic 76.8% |
| Blacks/African Americans | 0.0 /100 | #314 | Tragic 76.8% |
| Ottawa | 0.0 /100 | #315 | Tragic 76.7% |
| Yaqui | 0.0 /100 | #316 | Tragic 76.5% |
| Cherokee | 0.0 /100 | #317 | Tragic 76.2% |
| Chickasaw | 0.0 /100 | #318 | Tragic 76.2% |
| Inupiat | 0.0 /100 | #319 | Tragic 76.1% |
| Yakama | 0.0 /100 | #320 | Tragic 75.8% |
| Seminole | 0.0 /100 | #321 | Tragic 75.5% |
| Dutch West Indians | 0.0 /100 | #322 | Tragic 75.5% |