Barbadian vs Portuguese In Labor Force | Age 20-64
COMPARE
Barbadian
Portuguese
In Labor Force | Age 20-64
In Labor Force | Age 20-64 Comparison
Barbadians
Portuguese
78.8%
IN LABOR FORCE | AGE 20-64
0.7/ 100
METRIC RATING
251st/ 347
METRIC RANK
79.1%
IN LABOR FORCE | AGE 20-64
6.4/ 100
METRIC RATING
225th/ 347
METRIC RANK
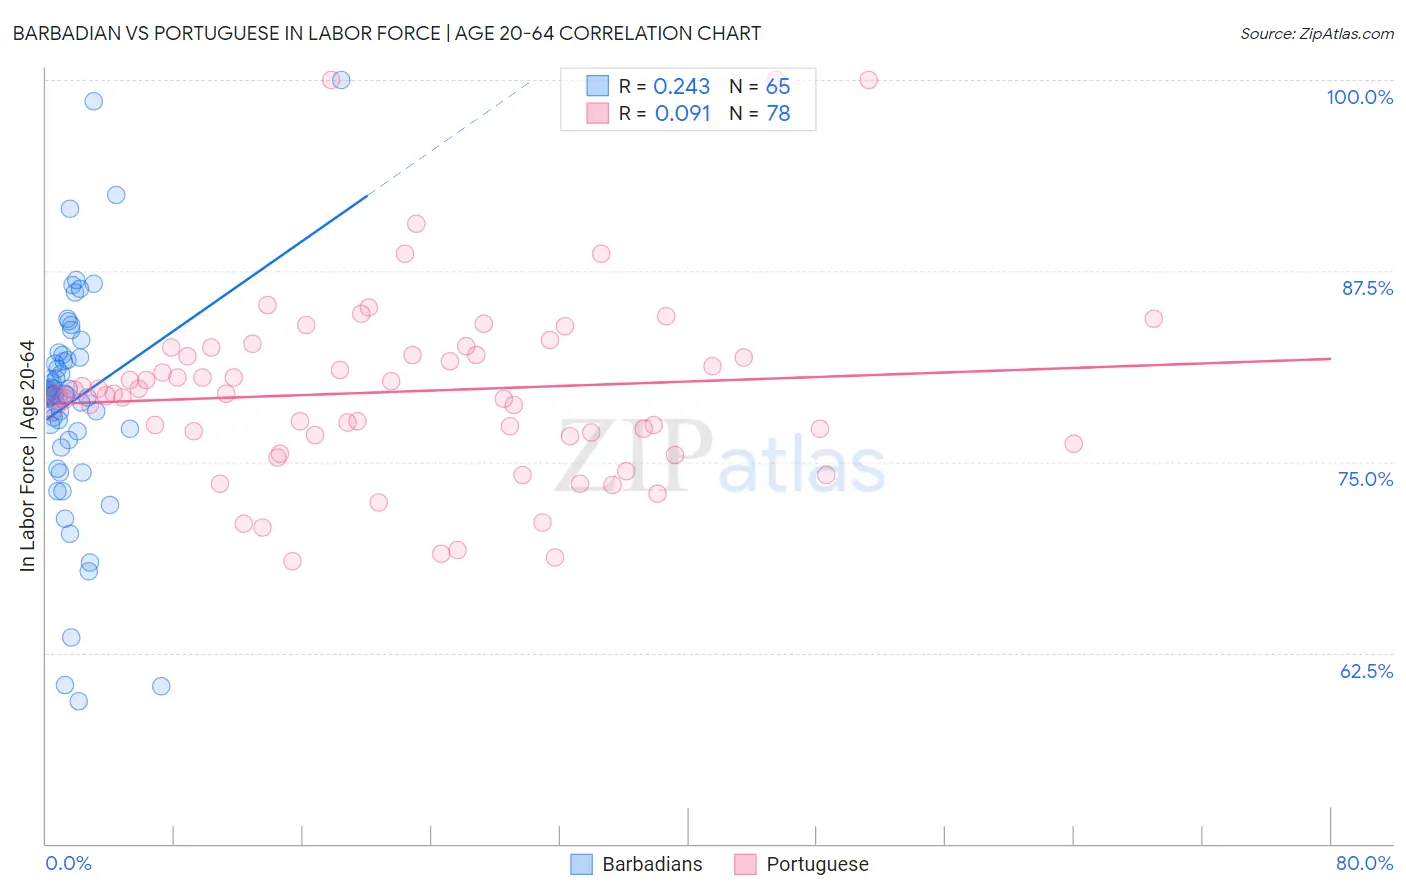
Barbadian vs Portuguese In Labor Force | Age 20-64 Correlation Chart
The statistical analysis conducted on geographies consisting of 141,304,311 people shows a weak positive correlation between the proportion of Barbadians and labor force participation rate among population between the ages 20 and 64 in the United States with a correlation coefficient (R) of 0.243 and weighted average of 78.8%. Similarly, the statistical analysis conducted on geographies consisting of 450,360,065 people shows a slight positive correlation between the proportion of Portuguese and labor force participation rate among population between the ages 20 and 64 in the United States with a correlation coefficient (R) of 0.091 and weighted average of 79.1%, a difference of 0.45%.
In Labor Force | Age 20-64 Correlation Summary
| Measurement | Barbadian | Portuguese |
| Minimum | 59.3% | 68.5% |
| Maximum | 100.0% | 100.0% |
| Range | 40.7% | 31.5% |
| Mean | 79.0% | 79.6% |
| Median | 79.4% | 79.4% |
| Interquartile 25% (IQ1) | 76.7% | 76.7% |
| Interquartile 75% (IQ3) | 81.9% | 82.0% |
| Interquartile Range (IQR) | 5.2% | 5.3% |
| Standard Deviation (Sample) | 7.4% | 6.2% |
| Standard Deviation (Population) | 7.4% | 6.1% |
Similar Demographics by In Labor Force | Age 20-64
Demographics Similar to Barbadians by In Labor Force | Age 20-64
In terms of in labor force | age 20-64, the demographic groups most similar to Barbadians are English (78.8%, a difference of 0.030%), Honduran (78.8%, a difference of 0.030%), Immigrants from Honduras (78.7%, a difference of 0.050%), Immigrants from Germany (78.8%, a difference of 0.060%), and Immigrants from Caribbean (78.8%, a difference of 0.060%).
| Demographics | Rating | Rank | In Labor Force | Age 20-64 |
| French | 1.5 /100 | #244 | Tragic 78.9% |
| Scottish | 1.3 /100 | #245 | Tragic 78.9% |
| Immigrants | Trinidad and Tobago | 1.1 /100 | #246 | Tragic 78.8% |
| Immigrants | Germany | 1.0 /100 | #247 | Tragic 78.8% |
| Immigrants | Caribbean | 1.0 /100 | #248 | Tragic 78.8% |
| English | 0.9 /100 | #249 | Tragic 78.8% |
| Hondurans | 0.8 /100 | #250 | Tragic 78.8% |
| Barbadians | 0.7 /100 | #251 | Tragic 78.8% |
| Immigrants | Honduras | 0.6 /100 | #252 | Tragic 78.7% |
| Basques | 0.5 /100 | #253 | Tragic 78.7% |
| Immigrants | Lebanon | 0.5 /100 | #254 | Tragic 78.7% |
| Hawaiians | 0.5 /100 | #255 | Tragic 78.7% |
| Celtics | 0.5 /100 | #256 | Tragic 78.7% |
| Guatemalans | 0.4 /100 | #257 | Tragic 78.7% |
| Immigrants | Guatemala | 0.4 /100 | #258 | Tragic 78.7% |
Demographics Similar to Portuguese by In Labor Force | Age 20-64
In terms of in labor force | age 20-64, the demographic groups most similar to Portuguese are Immigrants from Uzbekistan (79.1%, a difference of 0.010%), Immigrants from Panama (79.1%, a difference of 0.020%), Canadian (79.1%, a difference of 0.020%), Central American (79.1%, a difference of 0.020%), and Immigrants from Western Europe (79.1%, a difference of 0.020%).
| Demographics | Rating | Rank | In Labor Force | Age 20-64 |
| Immigrants | England | 9.3 /100 | #218 | Tragic 79.2% |
| French Canadians | 8.4 /100 | #219 | Tragic 79.2% |
| Immigrants | Immigrants | 7.7 /100 | #220 | Tragic 79.2% |
| Hungarians | 7.2 /100 | #221 | Tragic 79.2% |
| Immigrants | Panama | 6.9 /100 | #222 | Tragic 79.1% |
| Canadians | 6.8 /100 | #223 | Tragic 79.1% |
| Immigrants | Uzbekistan | 6.8 /100 | #224 | Tragic 79.1% |
| Portuguese | 6.4 /100 | #225 | Tragic 79.1% |
| Central Americans | 5.9 /100 | #226 | Tragic 79.1% |
| Immigrants | Western Europe | 5.9 /100 | #227 | Tragic 79.1% |
| Panamanians | 5.7 /100 | #228 | Tragic 79.1% |
| Alsatians | 5.7 /100 | #229 | Tragic 79.1% |
| Native Hawaiians | 5.6 /100 | #230 | Tragic 79.1% |
| Lebanese | 5.1 /100 | #231 | Tragic 79.1% |
| Guamanians/Chamorros | 4.5 /100 | #232 | Tragic 79.1% |