Ghanaian vs Immigrants from Poland In Labor Force | Age 20-24
COMPARE
Ghanaian
Immigrants from Poland
In Labor Force | Age 20-24
In Labor Force | Age 20-24 Comparison
Ghanaians
Immigrants from Poland
74.3%
IN LABOR FORCE | AGE 20-24
6.2/ 100
METRIC RATING
225th/ 347
METRIC RANK
76.1%
IN LABOR FORCE | AGE 20-24
97.7/ 100
METRIC RATING
101st/ 347
METRIC RANK
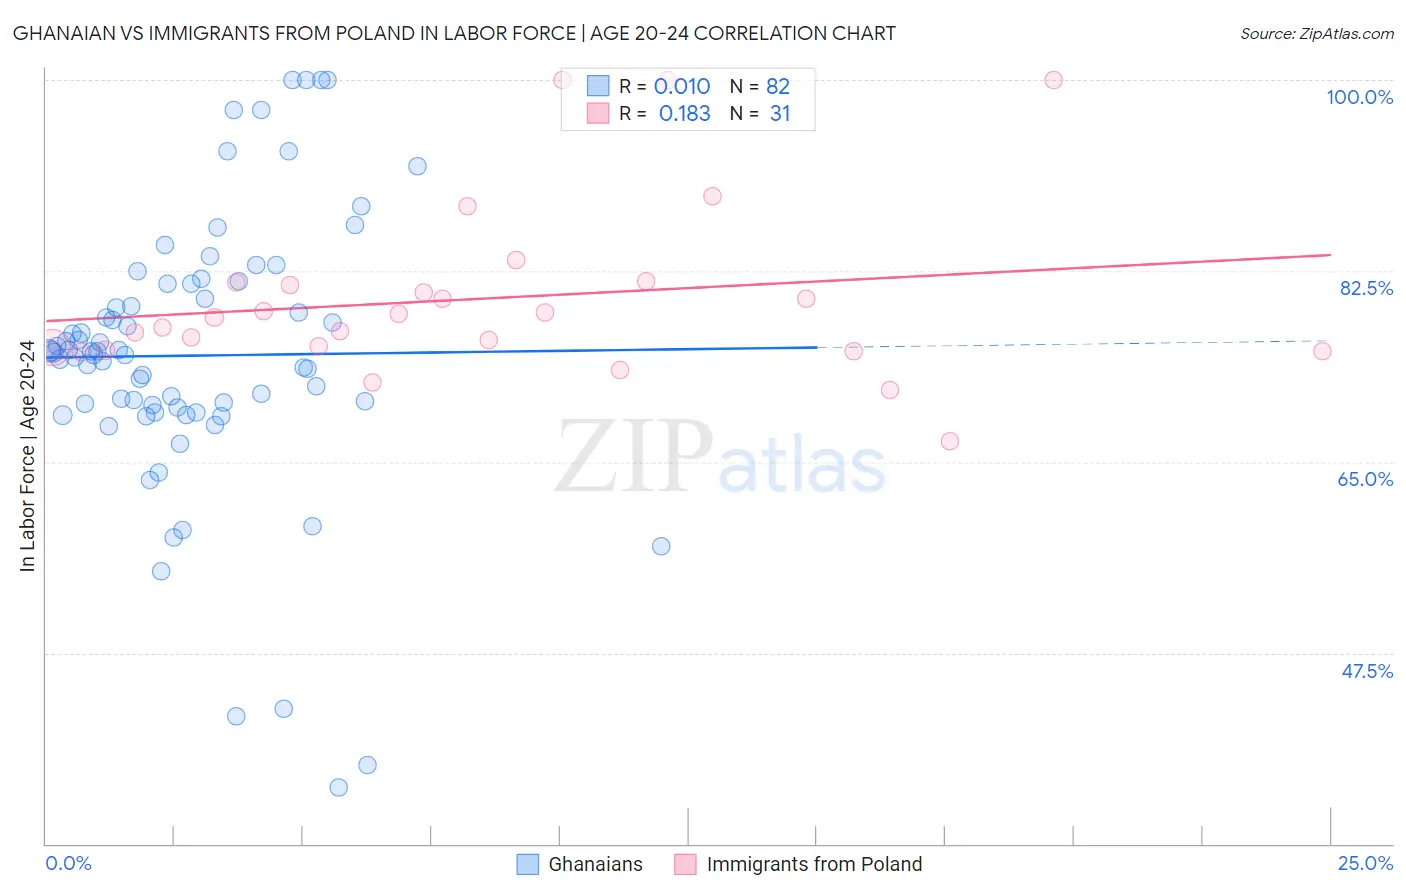
Ghanaian vs Immigrants from Poland In Labor Force | Age 20-24 Correlation Chart
The statistical analysis conducted on geographies consisting of 190,718,461 people shows no correlation between the proportion of Ghanaians and labor force participation rate among population between the ages 20 and 24 in the United States with a correlation coefficient (R) of 0.010 and weighted average of 74.3%. Similarly, the statistical analysis conducted on geographies consisting of 304,736,963 people shows a poor positive correlation between the proportion of Immigrants from Poland and labor force participation rate among population between the ages 20 and 24 in the United States with a correlation coefficient (R) of 0.183 and weighted average of 76.1%, a difference of 2.4%.
In Labor Force | Age 20-24 Correlation Summary
| Measurement | Ghanaian | Immigrants from Poland |
| Minimum | 35.2% | 66.9% |
| Maximum | 100.0% | 100.0% |
| Range | 64.8% | 33.1% |
| Mean | 74.7% | 80.0% |
| Median | 75.1% | 78.2% |
| Interquartile 25% (IQ1) | 70.0% | 75.2% |
| Interquartile 75% (IQ3) | 81.3% | 81.5% |
| Interquartile Range (IQR) | 11.3% | 6.3% |
| Standard Deviation (Sample) | 12.7% | 8.0% |
| Standard Deviation (Population) | 12.6% | 7.9% |
Similar Demographics by In Labor Force | Age 20-24
Demographics Similar to Ghanaians by In Labor Force | Age 20-24
In terms of in labor force | age 20-24, the demographic groups most similar to Ghanaians are Immigrants from Fiji (74.3%, a difference of 0.020%), Immigrants from Ireland (74.3%, a difference of 0.030%), Seminole (74.3%, a difference of 0.040%), Immigrants from Ukraine (74.2%, a difference of 0.080%), and Hispanic or Latino (74.4%, a difference of 0.10%).
| Demographics | Rating | Rank | In Labor Force | Age 20-24 |
| Immigrants | Peru | 10.6 /100 | #218 | Poor 74.5% |
| Nepalese | 10.5 /100 | #219 | Poor 74.5% |
| Immigrants | Norway | 10.3 /100 | #220 | Poor 74.5% |
| Chickasaw | 10.3 /100 | #221 | Poor 74.5% |
| Immigrants | India | 9.9 /100 | #222 | Tragic 74.4% |
| Hispanics or Latinos | 7.9 /100 | #223 | Tragic 74.4% |
| Seminole | 6.9 /100 | #224 | Tragic 74.3% |
| Ghanaians | 6.2 /100 | #225 | Tragic 74.3% |
| Immigrants | Fiji | 5.9 /100 | #226 | Tragic 74.3% |
| Immigrants | Ireland | 5.8 /100 | #227 | Tragic 74.3% |
| Immigrants | Ukraine | 5.1 /100 | #228 | Tragic 74.2% |
| Immigrants | Sweden | 4.6 /100 | #229 | Tragic 74.2% |
| Immigrants | Albania | 4.3 /100 | #230 | Tragic 74.2% |
| Immigrants | Greece | 4.1 /100 | #231 | Tragic 74.2% |
| Immigrants | Switzerland | 4.1 /100 | #232 | Tragic 74.2% |
Demographics Similar to Immigrants from Poland by In Labor Force | Age 20-24
In terms of in labor force | age 20-24, the demographic groups most similar to Immigrants from Poland are Latvian (76.1%, a difference of 0.010%), American (76.1%, a difference of 0.020%), Shoshone (76.1%, a difference of 0.020%), Immigrants from North Macedonia (76.1%, a difference of 0.030%), and Immigrants from Lithuania (76.1%, a difference of 0.050%).
| Demographics | Rating | Rank | In Labor Force | Age 20-24 |
| Potawatomi | 98.5 /100 | #94 | Exceptional 76.2% |
| Immigrants | Germany | 98.5 /100 | #95 | Exceptional 76.2% |
| Immigrants | Nonimmigrants | 98.5 /100 | #96 | Exceptional 76.2% |
| Immigrants | Lithuania | 98.0 /100 | #97 | Exceptional 76.1% |
| Immigrants | Oceania | 98.0 /100 | #98 | Exceptional 76.1% |
| Americans | 97.8 /100 | #99 | Exceptional 76.1% |
| Shoshone | 97.8 /100 | #100 | Exceptional 76.1% |
| Immigrants | Poland | 97.7 /100 | #101 | Exceptional 76.1% |
| Latvians | 97.6 /100 | #102 | Exceptional 76.1% |
| Immigrants | North Macedonia | 97.5 /100 | #103 | Exceptional 76.1% |
| Macedonians | 97.2 /100 | #104 | Exceptional 76.0% |
| Immigrants | Nepal | 97.2 /100 | #105 | Exceptional 76.0% |
| Immigrants | Uganda | 97.1 /100 | #106 | Exceptional 76.0% |
| Greeks | 96.9 /100 | #107 | Exceptional 76.0% |
| Iraqis | 96.6 /100 | #108 | Exceptional 76.0% |