Immigrants from Sierra Leone vs Immigrants from Poland In Labor Force | Age 20-24
COMPARE
Immigrants from Sierra Leone
Immigrants from Poland
In Labor Force | Age 20-24
In Labor Force | Age 20-24 Comparison
Immigrants from Sierra Leone
Immigrants from Poland
75.8%
IN LABOR FORCE | AGE 20-24
93.8/ 100
METRIC RATING
124th/ 347
METRIC RANK
76.1%
IN LABOR FORCE | AGE 20-24
97.7/ 100
METRIC RATING
101st/ 347
METRIC RANK
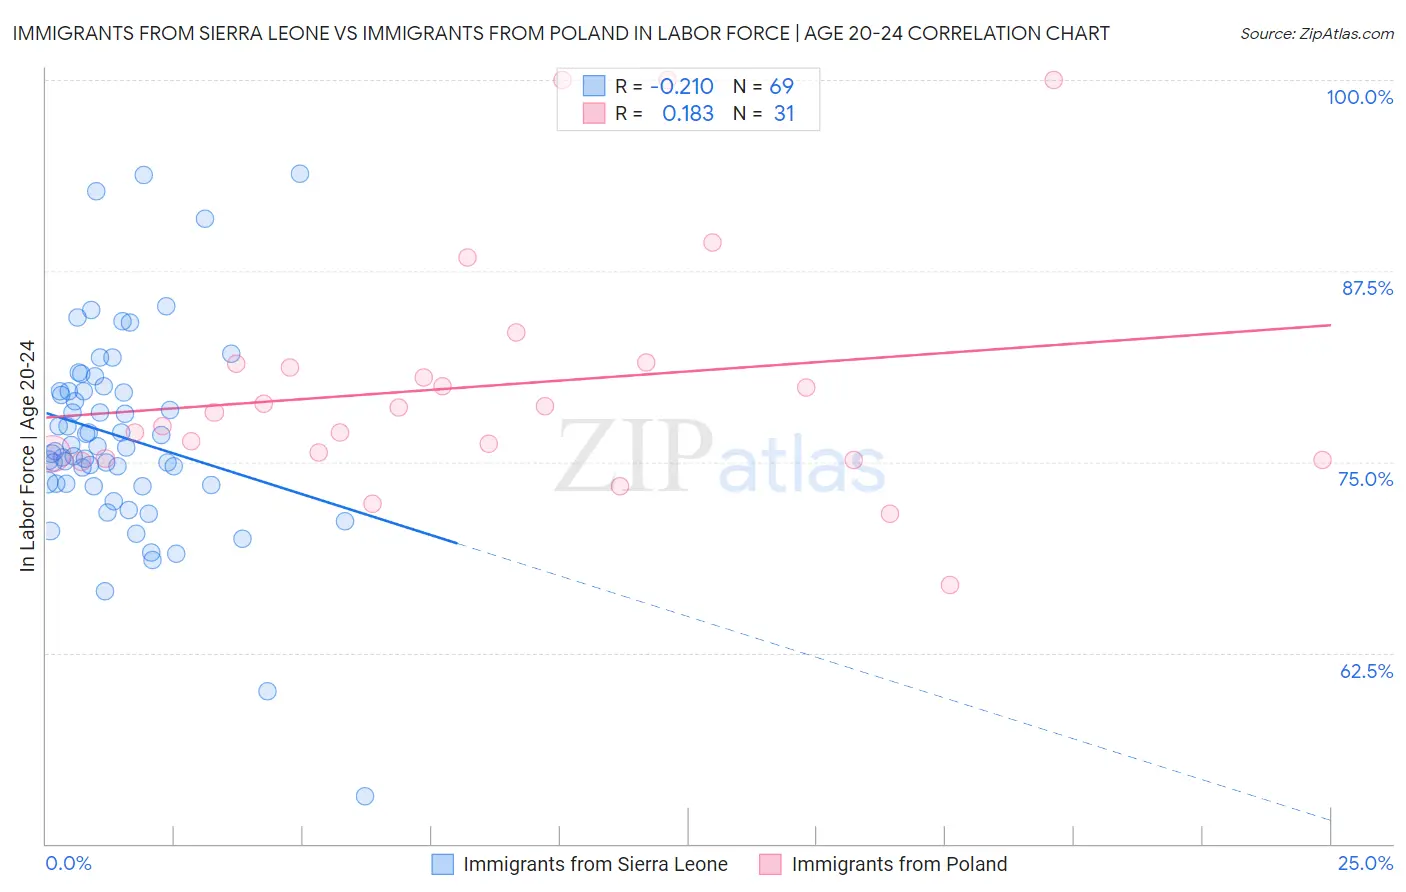
Immigrants from Sierra Leone vs Immigrants from Poland In Labor Force | Age 20-24 Correlation Chart
The statistical analysis conducted on geographies consisting of 101,648,861 people shows a weak negative correlation between the proportion of Immigrants from Sierra Leone and labor force participation rate among population between the ages 20 and 24 in the United States with a correlation coefficient (R) of -0.210 and weighted average of 75.8%. Similarly, the statistical analysis conducted on geographies consisting of 304,736,963 people shows a poor positive correlation between the proportion of Immigrants from Poland and labor force participation rate among population between the ages 20 and 24 in the United States with a correlation coefficient (R) of 0.183 and weighted average of 76.1%, a difference of 0.37%.
In Labor Force | Age 20-24 Correlation Summary
| Measurement | Immigrants from Sierra Leone | Immigrants from Poland |
| Minimum | 53.1% | 66.9% |
| Maximum | 93.9% | 100.0% |
| Range | 40.8% | 33.1% |
| Mean | 76.7% | 80.0% |
| Median | 75.9% | 78.2% |
| Interquartile 25% (IQ1) | 73.5% | 75.2% |
| Interquartile 75% (IQ3) | 79.6% | 81.5% |
| Interquartile Range (IQR) | 6.1% | 6.3% |
| Standard Deviation (Sample) | 6.7% | 8.0% |
| Standard Deviation (Population) | 6.6% | 7.9% |
Similar Demographics by In Labor Force | Age 20-24
Demographics Similar to Immigrants from Sierra Leone by In Labor Force | Age 20-24
In terms of in labor force | age 20-24, the demographic groups most similar to Immigrants from Sierra Leone are Immigrants from Scotland (75.8%, a difference of 0.010%), Pakistani (75.8%, a difference of 0.020%), Immigrants from Bulgaria (75.8%, a difference of 0.020%), Immigrants from Serbia (75.8%, a difference of 0.030%), and Immigrants from Africa (75.8%, a difference of 0.050%).
| Demographics | Rating | Rank | In Labor Force | Age 20-24 |
| Assyrians/Chaldeans/Syriacs | 94.9 /100 | #117 | Exceptional 75.9% |
| Spanish Americans | 94.8 /100 | #118 | Exceptional 75.8% |
| Immigrants | Portugal | 94.8 /100 | #119 | Exceptional 75.8% |
| Immigrants | Africa | 94.6 /100 | #120 | Exceptional 75.8% |
| Immigrants | Serbia | 94.3 /100 | #121 | Exceptional 75.8% |
| Pakistanis | 94.1 /100 | #122 | Exceptional 75.8% |
| Immigrants | Bulgaria | 94.1 /100 | #123 | Exceptional 75.8% |
| Immigrants | Sierra Leone | 93.8 /100 | #124 | Exceptional 75.8% |
| Immigrants | Scotland | 93.7 /100 | #125 | Exceptional 75.8% |
| Brazilians | 93.0 /100 | #126 | Exceptional 75.8% |
| Sub-Saharan Africans | 90.9 /100 | #127 | Exceptional 75.7% |
| Immigrants | Afghanistan | 89.4 /100 | #128 | Excellent 75.6% |
| Iroquois | 89.1 /100 | #129 | Excellent 75.6% |
| Immigrants | Austria | 88.8 /100 | #130 | Excellent 75.6% |
| Immigrants | Jordan | 88.5 /100 | #131 | Excellent 75.6% |
Demographics Similar to Immigrants from Poland by In Labor Force | Age 20-24
In terms of in labor force | age 20-24, the demographic groups most similar to Immigrants from Poland are Latvian (76.1%, a difference of 0.010%), American (76.1%, a difference of 0.020%), Shoshone (76.1%, a difference of 0.020%), Immigrants from North Macedonia (76.1%, a difference of 0.030%), and Immigrants from Lithuania (76.1%, a difference of 0.050%).
| Demographics | Rating | Rank | In Labor Force | Age 20-24 |
| Potawatomi | 98.5 /100 | #94 | Exceptional 76.2% |
| Immigrants | Germany | 98.5 /100 | #95 | Exceptional 76.2% |
| Immigrants | Nonimmigrants | 98.5 /100 | #96 | Exceptional 76.2% |
| Immigrants | Lithuania | 98.0 /100 | #97 | Exceptional 76.1% |
| Immigrants | Oceania | 98.0 /100 | #98 | Exceptional 76.1% |
| Americans | 97.8 /100 | #99 | Exceptional 76.1% |
| Shoshone | 97.8 /100 | #100 | Exceptional 76.1% |
| Immigrants | Poland | 97.7 /100 | #101 | Exceptional 76.1% |
| Latvians | 97.6 /100 | #102 | Exceptional 76.1% |
| Immigrants | North Macedonia | 97.5 /100 | #103 | Exceptional 76.1% |
| Macedonians | 97.2 /100 | #104 | Exceptional 76.0% |
| Immigrants | Nepal | 97.2 /100 | #105 | Exceptional 76.0% |
| Immigrants | Uganda | 97.1 /100 | #106 | Exceptional 76.0% |
| Greeks | 96.9 /100 | #107 | Exceptional 76.0% |
| Iraqis | 96.6 /100 | #108 | Exceptional 76.0% |