Asian vs Aleut In Labor Force | Age 16-19
COMPARE
Asian
Aleut
In Labor Force | Age 16-19
In Labor Force | Age 16-19 Comparison
Asians
Aleuts
34.1%
IN LABOR FORCE | AGE 16-19
0.4/ 100
METRIC RATING
272nd/ 347
METRIC RANK
40.4%
IN LABOR FORCE | AGE 16-19
100.0/ 100
METRIC RATING
58th/ 347
METRIC RANK
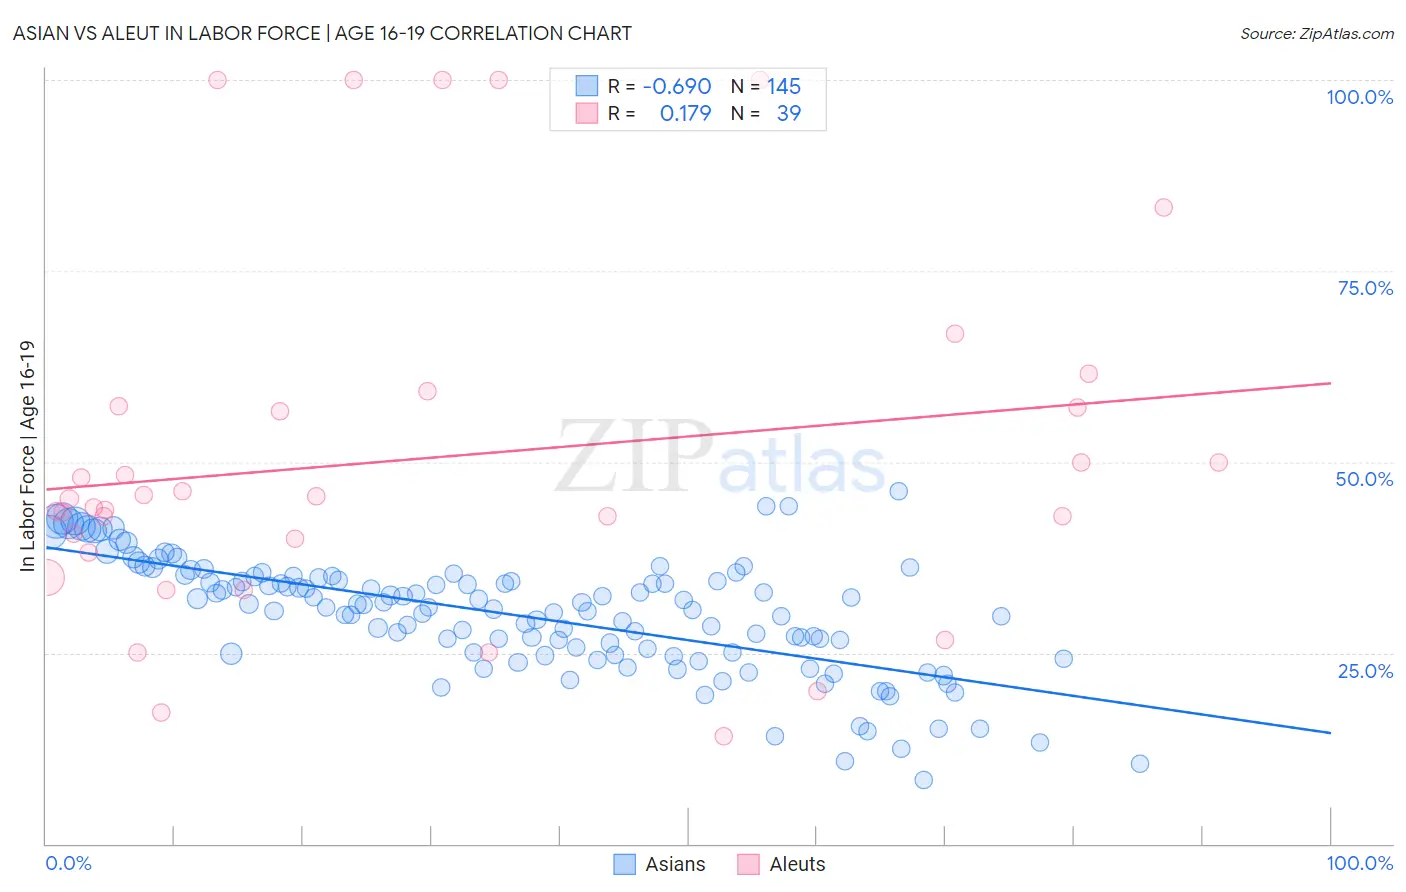
Asian vs Aleut In Labor Force | Age 16-19 Correlation Chart
The statistical analysis conducted on geographies consisting of 548,440,716 people shows a significant negative correlation between the proportion of Asians and labor force participation rate among population between the ages 16 and 19 in the United States with a correlation coefficient (R) of -0.690 and weighted average of 34.1%. Similarly, the statistical analysis conducted on geographies consisting of 61,744,567 people shows a poor positive correlation between the proportion of Aleuts and labor force participation rate among population between the ages 16 and 19 in the United States with a correlation coefficient (R) of 0.179 and weighted average of 40.4%, a difference of 18.7%.
In Labor Force | Age 16-19 Correlation Summary
| Measurement | Asian | Aleut |
| Minimum | 8.3% | 14.1% |
| Maximum | 46.1% | 100.0% |
| Range | 37.8% | 85.9% |
| Mean | 29.9% | 50.6% |
| Median | 30.9% | 45.1% |
| Interquartile 25% (IQ1) | 25.0% | 38.2% |
| Interquartile 75% (IQ3) | 34.9% | 57.3% |
| Interquartile Range (IQR) | 9.9% | 19.1% |
| Standard Deviation (Sample) | 7.6% | 23.4% |
| Standard Deviation (Population) | 7.6% | 23.1% |
Similar Demographics by In Labor Force | Age 16-19
Demographics Similar to Asians by In Labor Force | Age 16-19
In terms of in labor force | age 16-19, the demographic groups most similar to Asians are Immigrants from Russia (34.1%, a difference of 0.030%), Central American Indian (34.1%, a difference of 0.030%), Pima (34.1%, a difference of 0.070%), Immigrants from Asia (34.1%, a difference of 0.16%), and Immigrants from Panama (34.0%, a difference of 0.22%).
| Demographics | Rating | Rank | In Labor Force | Age 16-19 |
| Immigrants | El Salvador | 0.7 /100 | #265 | Tragic 34.3% |
| Immigrants | Malaysia | 0.7 /100 | #266 | Tragic 34.3% |
| Immigrants | Peru | 0.5 /100 | #267 | Tragic 34.2% |
| Immigrants | Asia | 0.5 /100 | #268 | Tragic 34.1% |
| Pima | 0.5 /100 | #269 | Tragic 34.1% |
| Immigrants | Russia | 0.4 /100 | #270 | Tragic 34.1% |
| Central American Indians | 0.4 /100 | #271 | Tragic 34.1% |
| Asians | 0.4 /100 | #272 | Tragic 34.1% |
| Immigrants | Panama | 0.4 /100 | #273 | Tragic 34.0% |
| Venezuelans | 0.3 /100 | #274 | Tragic 34.0% |
| Immigrants | Fiji | 0.3 /100 | #275 | Tragic 33.9% |
| Immigrants | Latin America | 0.3 /100 | #276 | Tragic 33.9% |
| Menominee | 0.3 /100 | #277 | Tragic 33.9% |
| Colombians | 0.3 /100 | #278 | Tragic 33.8% |
| Paraguayans | 0.3 /100 | #279 | Tragic 33.8% |
Demographics Similar to Aleuts by In Labor Force | Age 16-19
In terms of in labor force | age 16-19, the demographic groups most similar to Aleuts are Lithuanian (40.4%, a difference of 0.010%), Fijian (40.4%, a difference of 0.040%), British (40.5%, a difference of 0.13%), Slavic (40.4%, a difference of 0.13%), and Tlingit-Haida (40.5%, a difference of 0.16%).
| Demographics | Rating | Rank | In Labor Force | Age 16-19 |
| Immigrants | Zaire | 100.0 /100 | #51 | Exceptional 40.7% |
| Immigrants | Laos | 100.0 /100 | #52 | Exceptional 40.6% |
| Immigrants | Kenya | 100.0 /100 | #53 | Exceptional 40.5% |
| Tlingit-Haida | 100.0 /100 | #54 | Exceptional 40.5% |
| British | 100.0 /100 | #55 | Exceptional 40.5% |
| Fijians | 100.0 /100 | #56 | Exceptional 40.4% |
| Lithuanians | 100.0 /100 | #57 | Exceptional 40.4% |
| Aleuts | 100.0 /100 | #58 | Exceptional 40.4% |
| Slavs | 100.0 /100 | #59 | Exceptional 40.4% |
| Immigrants | Eastern Africa | 100.0 /100 | #60 | Exceptional 40.4% |
| Americans | 100.0 /100 | #61 | Exceptional 40.3% |
| Cherokee | 100.0 /100 | #62 | Exceptional 40.2% |
| Northern Europeans | 100.0 /100 | #63 | Exceptional 40.2% |
| Immigrants | Micronesia | 100.0 /100 | #64 | Exceptional 40.2% |
| Kenyans | 100.0 /100 | #65 | Exceptional 40.1% |