Asian vs Malaysian In Labor Force | Age 16-19
COMPARE
Asian
Malaysian
In Labor Force | Age 16-19
In Labor Force | Age 16-19 Comparison
Asians
Malaysians
34.1%
IN LABOR FORCE | AGE 16-19
0.4/ 100
METRIC RATING
272nd/ 347
METRIC RANK
39.7%
IN LABOR FORCE | AGE 16-19
99.9/ 100
METRIC RATING
76th/ 347
METRIC RANK
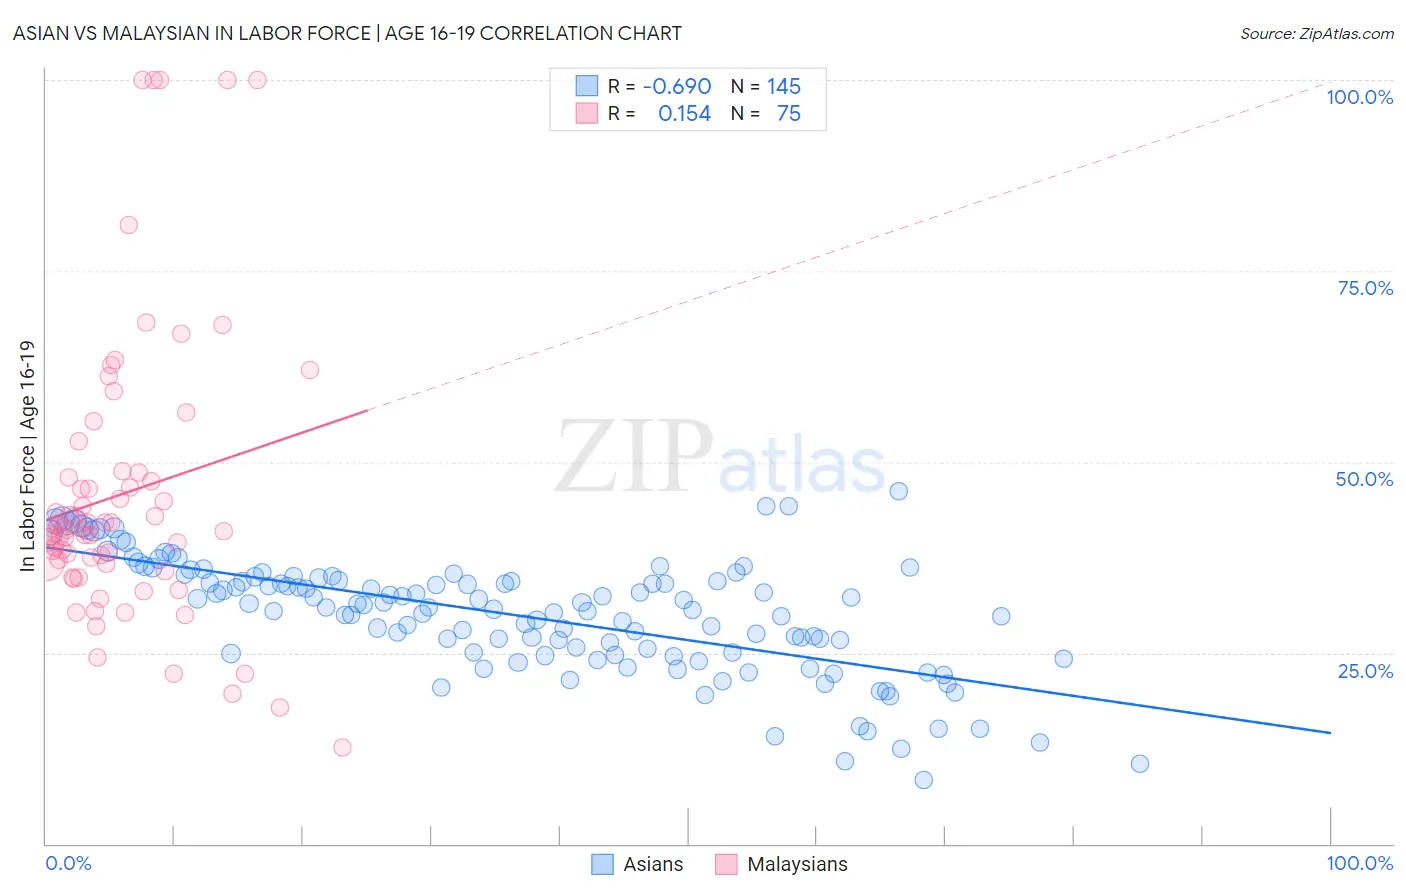
Asian vs Malaysian In Labor Force | Age 16-19 Correlation Chart
The statistical analysis conducted on geographies consisting of 548,440,716 people shows a significant negative correlation between the proportion of Asians and labor force participation rate among population between the ages 16 and 19 in the United States with a correlation coefficient (R) of -0.690 and weighted average of 34.1%. Similarly, the statistical analysis conducted on geographies consisting of 225,967,692 people shows a poor positive correlation between the proportion of Malaysians and labor force participation rate among population between the ages 16 and 19 in the United States with a correlation coefficient (R) of 0.154 and weighted average of 39.7%, a difference of 16.6%.
In Labor Force | Age 16-19 Correlation Summary
| Measurement | Asian | Malaysian |
| Minimum | 8.3% | 12.6% |
| Maximum | 46.1% | 100.0% |
| Range | 37.8% | 87.4% |
| Mean | 29.9% | 45.8% |
| Median | 30.9% | 41.3% |
| Interquartile 25% (IQ1) | 25.0% | 36.7% |
| Interquartile 75% (IQ3) | 34.9% | 48.6% |
| Interquartile Range (IQR) | 9.9% | 11.9% |
| Standard Deviation (Sample) | 7.6% | 18.9% |
| Standard Deviation (Population) | 7.6% | 18.8% |
Similar Demographics by In Labor Force | Age 16-19
Demographics Similar to Asians by In Labor Force | Age 16-19
In terms of in labor force | age 16-19, the demographic groups most similar to Asians are Immigrants from Russia (34.1%, a difference of 0.030%), Central American Indian (34.1%, a difference of 0.030%), Pima (34.1%, a difference of 0.070%), Immigrants from Asia (34.1%, a difference of 0.16%), and Immigrants from Panama (34.0%, a difference of 0.22%).
| Demographics | Rating | Rank | In Labor Force | Age 16-19 |
| Immigrants | El Salvador | 0.7 /100 | #265 | Tragic 34.3% |
| Immigrants | Malaysia | 0.7 /100 | #266 | Tragic 34.3% |
| Immigrants | Peru | 0.5 /100 | #267 | Tragic 34.2% |
| Immigrants | Asia | 0.5 /100 | #268 | Tragic 34.1% |
| Pima | 0.5 /100 | #269 | Tragic 34.1% |
| Immigrants | Russia | 0.4 /100 | #270 | Tragic 34.1% |
| Central American Indians | 0.4 /100 | #271 | Tragic 34.1% |
| Asians | 0.4 /100 | #272 | Tragic 34.1% |
| Immigrants | Panama | 0.4 /100 | #273 | Tragic 34.0% |
| Venezuelans | 0.3 /100 | #274 | Tragic 34.0% |
| Immigrants | Fiji | 0.3 /100 | #275 | Tragic 33.9% |
| Immigrants | Latin America | 0.3 /100 | #276 | Tragic 33.9% |
| Menominee | 0.3 /100 | #277 | Tragic 33.9% |
| Colombians | 0.3 /100 | #278 | Tragic 33.8% |
| Paraguayans | 0.3 /100 | #279 | Tragic 33.8% |
Demographics Similar to Malaysians by In Labor Force | Age 16-19
In terms of in labor force | age 16-19, the demographic groups most similar to Malaysians are Immigrants from Portugal (39.7%, a difference of 0.13%), French American Indian (39.8%, a difference of 0.27%), Hungarian (39.8%, a difference of 0.29%), Immigrants from Middle Africa (39.9%, a difference of 0.52%), and Austrian (39.5%, a difference of 0.52%).
| Demographics | Rating | Rank | In Labor Force | Age 16-19 |
| Potawatomi | 99.9 /100 | #69 | Exceptional 40.0% |
| Portuguese | 99.9 /100 | #70 | Exceptional 40.0% |
| Serbians | 99.9 /100 | #71 | Exceptional 39.9% |
| Iroquois | 99.9 /100 | #72 | Exceptional 39.9% |
| Immigrants | Middle Africa | 99.9 /100 | #73 | Exceptional 39.9% |
| Hungarians | 99.9 /100 | #74 | Exceptional 39.8% |
| French American Indians | 99.9 /100 | #75 | Exceptional 39.8% |
| Malaysians | 99.9 /100 | #76 | Exceptional 39.7% |
| Immigrants | Portugal | 99.9 /100 | #77 | Exceptional 39.7% |
| Austrians | 99.8 /100 | #78 | Exceptional 39.5% |
| Marshallese | 99.8 /100 | #79 | Exceptional 39.5% |
| Immigrants | Iraq | 99.8 /100 | #80 | Exceptional 39.4% |
| Shoshone | 99.7 /100 | #81 | Exceptional 39.3% |
| Basques | 99.7 /100 | #82 | Exceptional 39.3% |
| Spanish | 99.7 /100 | #83 | Exceptional 39.3% |