Asian vs Immigrants from Burma/Myanmar In Labor Force | Age 20-24
COMPARE
Asian
Immigrants from Burma/Myanmar
In Labor Force | Age 20-24
In Labor Force | Age 20-24 Comparison
Asians
Immigrants from Burma/Myanmar
73.7%
IN LABOR FORCE | AGE 20-24
0.6/ 100
METRIC RATING
262nd/ 347
METRIC RANK
76.3%
IN LABOR FORCE | AGE 20-24
99.1/ 100
METRIC RATING
90th/ 347
METRIC RANK
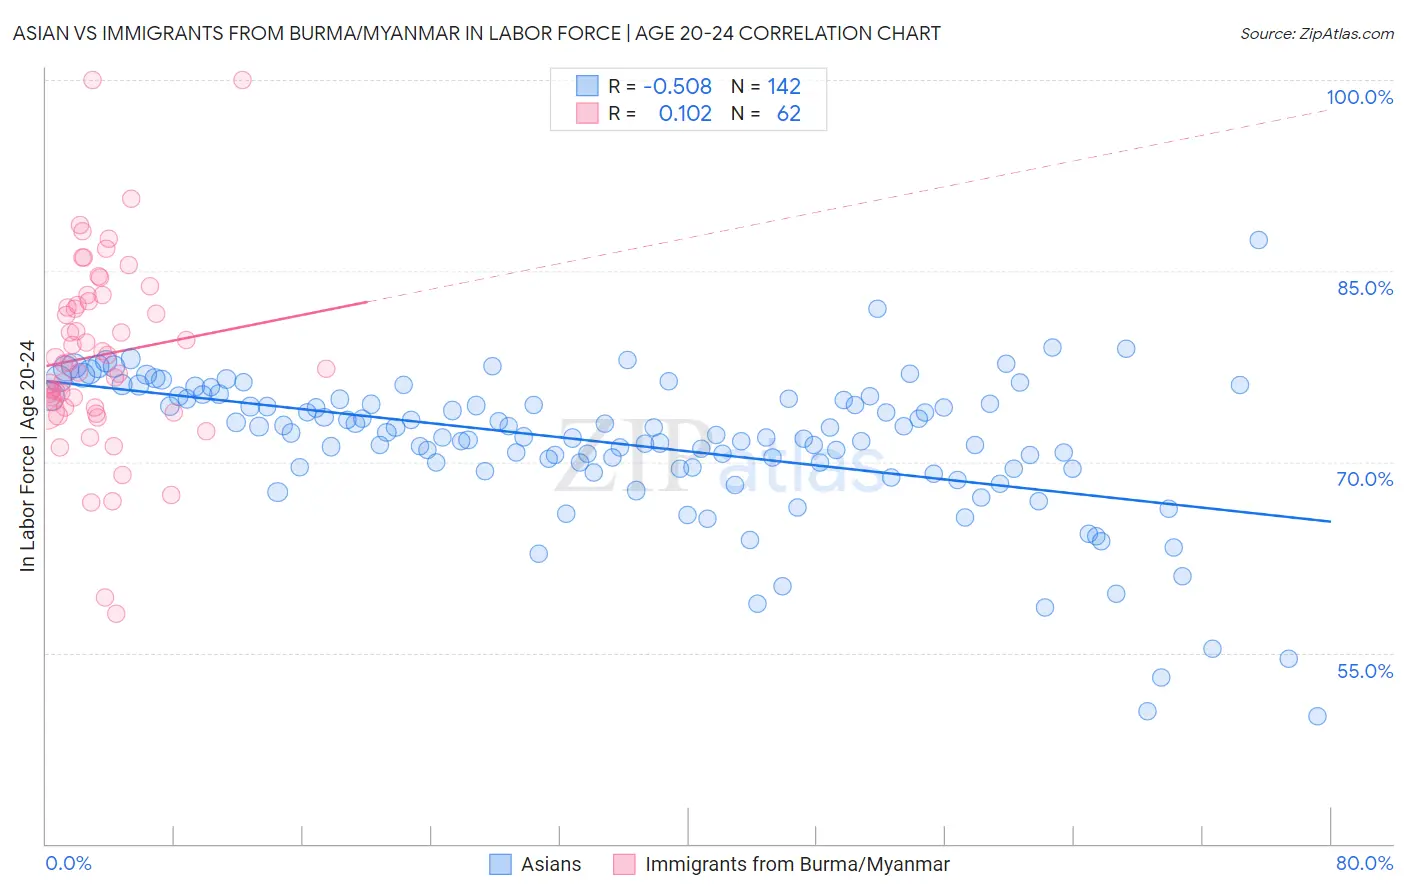
Asian vs Immigrants from Burma/Myanmar In Labor Force | Age 20-24 Correlation Chart
The statistical analysis conducted on geographies consisting of 550,133,800 people shows a substantial negative correlation between the proportion of Asians and labor force participation rate among population between the ages 20 and 24 in the United States with a correlation coefficient (R) of -0.508 and weighted average of 73.7%. Similarly, the statistical analysis conducted on geographies consisting of 172,353,766 people shows a poor positive correlation between the proportion of Immigrants from Burma/Myanmar and labor force participation rate among population between the ages 20 and 24 in the United States with a correlation coefficient (R) of 0.102 and weighted average of 76.3%, a difference of 3.6%.
In Labor Force | Age 20-24 Correlation Summary
| Measurement | Asian | Immigrants from Burma/Myanmar |
| Minimum | 50.0% | 58.1% |
| Maximum | 87.4% | 100.0% |
| Range | 37.4% | 41.9% |
| Mean | 71.4% | 78.4% |
| Median | 72.2% | 77.8% |
| Interquartile 25% (IQ1) | 69.5% | 74.3% |
| Interquartile 75% (IQ3) | 75.0% | 82.6% |
| Interquartile Range (IQR) | 5.5% | 8.3% |
| Standard Deviation (Sample) | 5.8% | 7.6% |
| Standard Deviation (Population) | 5.8% | 7.5% |
Similar Demographics by In Labor Force | Age 20-24
Demographics Similar to Asians by In Labor Force | Age 20-24
In terms of in labor force | age 20-24, the demographic groups most similar to Asians are Houma (73.7%, a difference of 0.010%), Immigrants from Turkey (73.7%, a difference of 0.020%), Egyptian (73.7%, a difference of 0.050%), Dutch West Indian (73.7%, a difference of 0.050%), and Immigrants from Asia (73.6%, a difference of 0.080%).
| Demographics | Rating | Rank | In Labor Force | Age 20-24 |
| Immigrants | Pakistan | 0.9 /100 | #255 | Tragic 73.8% |
| Spanish American Indians | 0.8 /100 | #256 | Tragic 73.7% |
| Paraguayans | 0.8 /100 | #257 | Tragic 73.7% |
| Egyptians | 0.7 /100 | #258 | Tragic 73.7% |
| Dutch West Indians | 0.7 /100 | #259 | Tragic 73.7% |
| Immigrants | Turkey | 0.7 /100 | #260 | Tragic 73.7% |
| Houma | 0.6 /100 | #261 | Tragic 73.7% |
| Asians | 0.6 /100 | #262 | Tragic 73.7% |
| Immigrants | Asia | 0.5 /100 | #263 | Tragic 73.6% |
| Immigrants | Haiti | 0.5 /100 | #264 | Tragic 73.6% |
| Burmese | 0.5 /100 | #265 | Tragic 73.6% |
| Haitians | 0.5 /100 | #266 | Tragic 73.6% |
| Immigrants | Western Asia | 0.4 /100 | #267 | Tragic 73.5% |
| South Americans | 0.4 /100 | #268 | Tragic 73.5% |
| Colombians | 0.3 /100 | #269 | Tragic 73.5% |
Demographics Similar to Immigrants from Burma/Myanmar by In Labor Force | Age 20-24
In terms of in labor force | age 20-24, the demographic groups most similar to Immigrants from Burma/Myanmar are Sierra Leonean (76.3%, a difference of 0.020%), Spanish (76.4%, a difference of 0.050%), Bulgarian (76.4%, a difference of 0.050%), Maltese (76.3%, a difference of 0.050%), and Hungarian (76.3%, a difference of 0.070%).
| Demographics | Rating | Rank | In Labor Force | Age 20-24 |
| Carpatho Rusyns | 99.4 /100 | #83 | Exceptional 76.5% |
| Austrians | 99.4 /100 | #84 | Exceptional 76.5% |
| Portuguese | 99.3 /100 | #85 | Exceptional 76.4% |
| Immigrants | Iraq | 99.3 /100 | #86 | Exceptional 76.4% |
| Immigrants | Thailand | 99.3 /100 | #87 | Exceptional 76.4% |
| Spanish | 99.2 /100 | #88 | Exceptional 76.4% |
| Bulgarians | 99.2 /100 | #89 | Exceptional 76.4% |
| Immigrants | Burma/Myanmar | 99.1 /100 | #90 | Exceptional 76.3% |
| Sierra Leoneans | 99.0 /100 | #91 | Exceptional 76.3% |
| Maltese | 98.9 /100 | #92 | Exceptional 76.3% |
| Hungarians | 98.9 /100 | #93 | Exceptional 76.3% |
| Potawatomi | 98.5 /100 | #94 | Exceptional 76.2% |
| Immigrants | Germany | 98.5 /100 | #95 | Exceptional 76.2% |
| Immigrants | Nonimmigrants | 98.5 /100 | #96 | Exceptional 76.2% |
| Immigrants | Lithuania | 98.0 /100 | #97 | Exceptional 76.1% |