Asian vs Dutch In Labor Force | Age 20-24
COMPARE
Asian
Dutch
In Labor Force | Age 20-24
In Labor Force | Age 20-24 Comparison
Asians
Dutch
73.7%
IN LABOR FORCE | AGE 20-24
0.6/ 100
METRIC RATING
262nd/ 347
METRIC RANK
78.4%
IN LABOR FORCE | AGE 20-24
100.0/ 100
METRIC RATING
16th/ 347
METRIC RANK
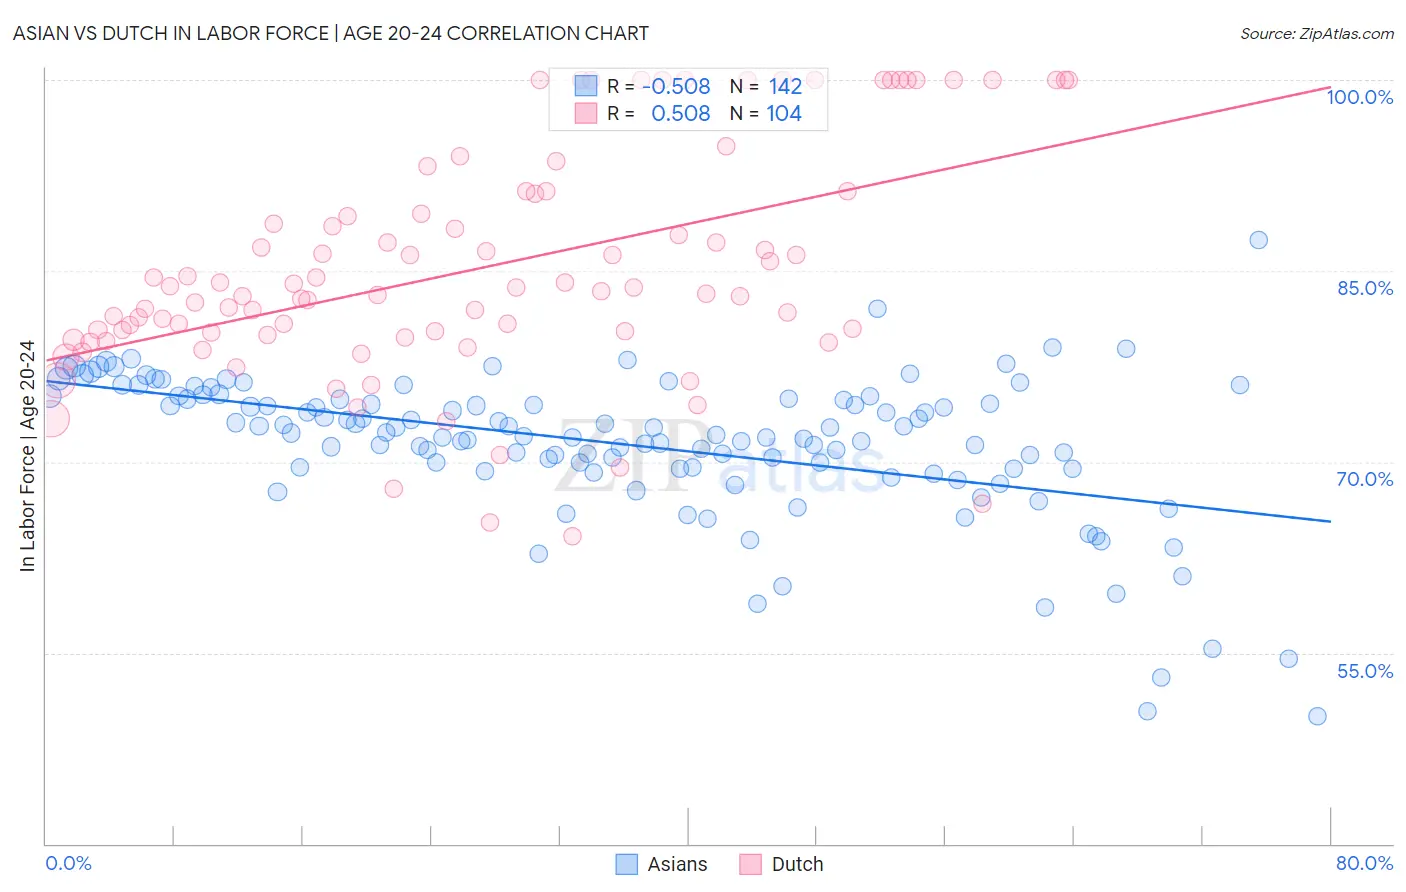
Asian vs Dutch In Labor Force | Age 20-24 Correlation Chart
The statistical analysis conducted on geographies consisting of 550,133,800 people shows a substantial negative correlation between the proportion of Asians and labor force participation rate among population between the ages 20 and 24 in the United States with a correlation coefficient (R) of -0.508 and weighted average of 73.7%. Similarly, the statistical analysis conducted on geographies consisting of 553,167,013 people shows a substantial positive correlation between the proportion of Dutch and labor force participation rate among population between the ages 20 and 24 in the United States with a correlation coefficient (R) of 0.508 and weighted average of 78.4%, a difference of 6.4%.
In Labor Force | Age 20-24 Correlation Summary
| Measurement | Asian | Dutch |
| Minimum | 50.0% | 64.1% |
| Maximum | 87.4% | 100.0% |
| Range | 37.4% | 35.9% |
| Mean | 71.4% | 85.3% |
| Median | 72.2% | 83.6% |
| Interquartile 25% (IQ1) | 69.5% | 80.1% |
| Interquartile 75% (IQ3) | 75.0% | 91.2% |
| Interquartile Range (IQR) | 5.5% | 11.1% |
| Standard Deviation (Sample) | 5.8% | 9.0% |
| Standard Deviation (Population) | 5.8% | 9.0% |
Similar Demographics by In Labor Force | Age 20-24
Demographics Similar to Asians by In Labor Force | Age 20-24
In terms of in labor force | age 20-24, the demographic groups most similar to Asians are Houma (73.7%, a difference of 0.010%), Immigrants from Turkey (73.7%, a difference of 0.020%), Egyptian (73.7%, a difference of 0.050%), Dutch West Indian (73.7%, a difference of 0.050%), and Immigrants from Asia (73.6%, a difference of 0.080%).
| Demographics | Rating | Rank | In Labor Force | Age 20-24 |
| Immigrants | Pakistan | 0.9 /100 | #255 | Tragic 73.8% |
| Spanish American Indians | 0.8 /100 | #256 | Tragic 73.7% |
| Paraguayans | 0.8 /100 | #257 | Tragic 73.7% |
| Egyptians | 0.7 /100 | #258 | Tragic 73.7% |
| Dutch West Indians | 0.7 /100 | #259 | Tragic 73.7% |
| Immigrants | Turkey | 0.7 /100 | #260 | Tragic 73.7% |
| Houma | 0.6 /100 | #261 | Tragic 73.7% |
| Asians | 0.6 /100 | #262 | Tragic 73.7% |
| Immigrants | Asia | 0.5 /100 | #263 | Tragic 73.6% |
| Immigrants | Haiti | 0.5 /100 | #264 | Tragic 73.6% |
| Burmese | 0.5 /100 | #265 | Tragic 73.6% |
| Haitians | 0.5 /100 | #266 | Tragic 73.6% |
| Immigrants | Western Asia | 0.4 /100 | #267 | Tragic 73.5% |
| South Americans | 0.4 /100 | #268 | Tragic 73.5% |
| Colombians | 0.3 /100 | #269 | Tragic 73.5% |
Demographics Similar to Dutch by In Labor Force | Age 20-24
In terms of in labor force | age 20-24, the demographic groups most similar to Dutch are Cape Verdean (78.3%, a difference of 0.040%), Sudanese (78.4%, a difference of 0.050%), Czech (78.5%, a difference of 0.18%), Scandinavian (78.5%, a difference of 0.19%), and German (78.6%, a difference of 0.26%).
| Demographics | Rating | Rank | In Labor Force | Age 20-24 |
| Swedes | 100.0 /100 | #9 | Exceptional 78.8% |
| Slovenes | 100.0 /100 | #10 | Exceptional 78.7% |
| Finns | 100.0 /100 | #11 | Exceptional 78.7% |
| Germans | 100.0 /100 | #12 | Exceptional 78.6% |
| Scandinavians | 100.0 /100 | #13 | Exceptional 78.5% |
| Czechs | 100.0 /100 | #14 | Exceptional 78.5% |
| Sudanese | 100.0 /100 | #15 | Exceptional 78.4% |
| Dutch | 100.0 /100 | #16 | Exceptional 78.4% |
| Cape Verdeans | 100.0 /100 | #17 | Exceptional 78.3% |
| Immigrants | Bosnia and Herzegovina | 100.0 /100 | #18 | Exceptional 78.1% |
| Bangladeshis | 100.0 /100 | #19 | Exceptional 78.1% |
| French Canadians | 100.0 /100 | #20 | Exceptional 78.1% |
| Puget Sound Salish | 100.0 /100 | #21 | Exceptional 78.0% |
| Pennsylvania Germans | 100.0 /100 | #22 | Exceptional 78.0% |
| Yugoslavians | 100.0 /100 | #23 | Exceptional 78.0% |